|
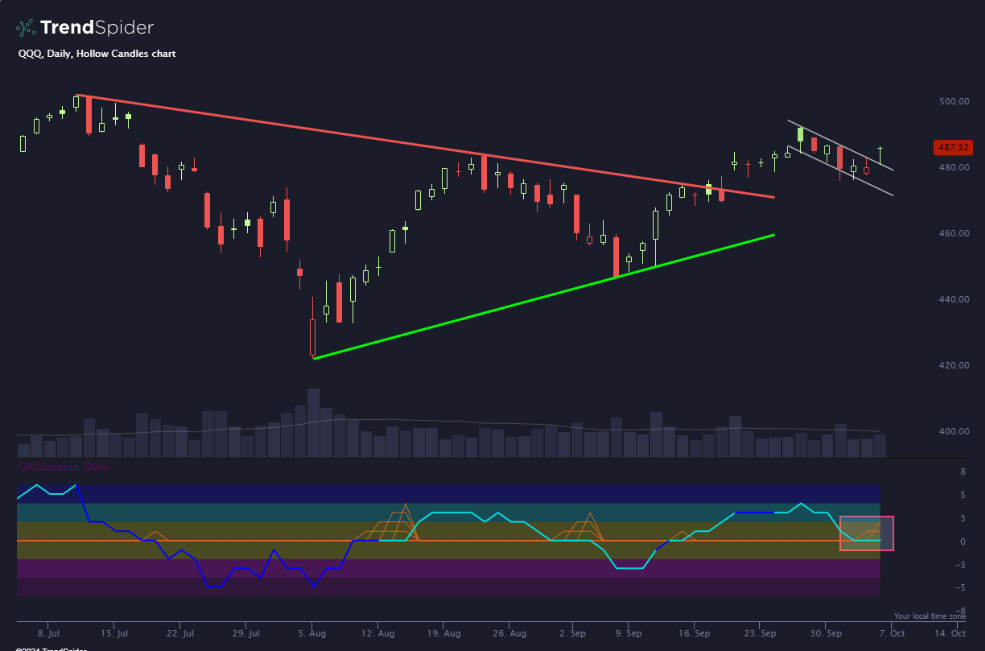
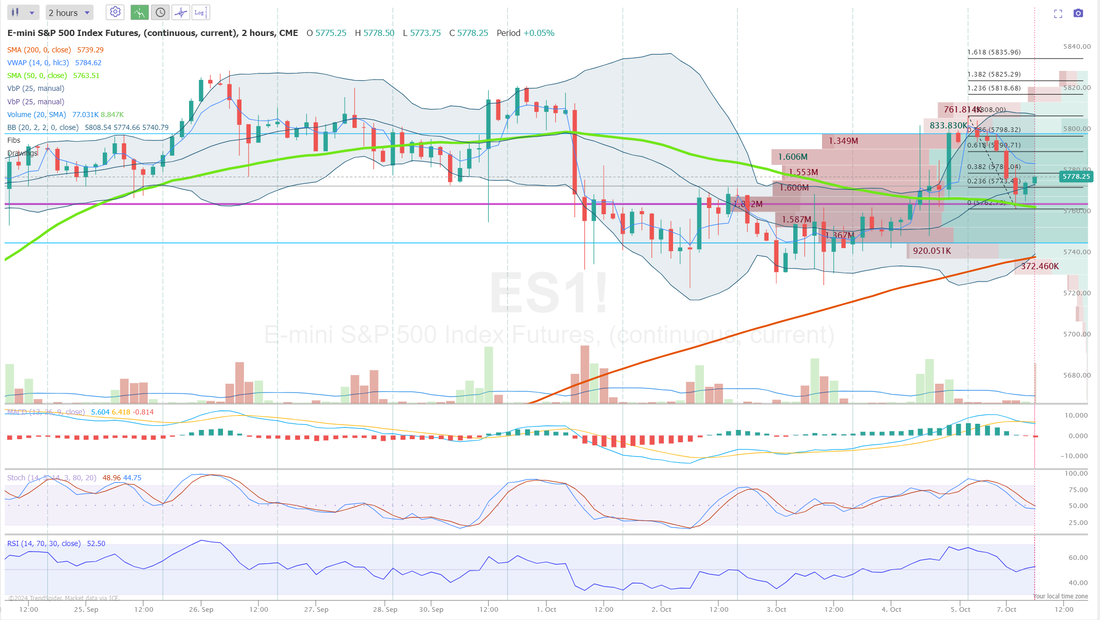
Welcome back to a new week traders! Our last Friday was just off the charts success. I've been doing my best to temper the excitement in the trading room. No...we will not just make $5,000+ a day forever! Losses will come. It's just the way it works, but for right now, it's been an amazing couple of weeks. Check out our results below: Let's take a look at the markets: Buy mode still hanging in there. Markets continue to pinch up at or close to their ATH's. The SPY made little headway this week, briefly dipping below last week’s low before rebounding to close slightly higher at $572.98 (+0.28%). As the price approaches the apex of the rising wedge, the GoNoGo Squeeze indicator shows the oscillator bouncing at the zero line, signaling that momentum has found support and is still in the favor of the bulls. Similar to SPY, QQQ made little progress this week but managed to break out of its smaller consolidation flag by Friday, closing at $487.32 (+0.11%). Momentum has been neutral for several sessions, which could indicate that the index is nearing a larger-scale breakout in the days ahead. The IWM ETF chart looks similar to QQQ, consolidating in a tight flag pattern just above the longer-term symmetrical triangle. Although it closed lower this week at $219.15 (-0.54%), the GoNoGo Squeeze shows a max grid pattern has formed. This means that momentum has been stuck in a non-directional state for quite some time and a directional break is imminent. Looking at the I.V. and expected moves for the week. Not bad folks. We may be able to get a few more Theta fairy's off this week. I'm not saying we are going to get a "double-dip day" like last week but it looks good. Trade docket for today: Jam packed with Non-equiry correlated issues. /ES (Theta fairy), /MNQ,QQQ scalping, /HE, /6A, /6B, /6A, /BTC, /ETH, /LE, /SI, /ZN, SMCI, WYNN, 0DTE's Let's take a look at intra-day levels for us today on our 0DTE's. #1. /ES: I look at today as a neutral day. The markets been pinching here for a while. 5780 is first resistance then 5790 with 5798 being the break out level I'm looking at for bullish continuation. 5773 is first support with 5763 my main, key level I'm watching. 5763 is the big support level. It's close to the PoC and 50 period moving average on the 2 hr. chart. A break below that would signal a clear, bearish price action. #2. /NQ: There are several resistance levels it needs to break above to get a bullish continuation. 20187, 20223,20266 specifically. To the downside, I'm only focused on 20036. This is the PoC and 50 period M.A. on the 2 hr. chart. A break below this could mean "look out below". #3. Bitcoin: BTC has a bit of a hard stop to the upside at 64,284. Support is 62,233 My bias or lean today is neutral. Until we break through some of these big support/resistance levels its all just chop. Let's make it happen today folks. And no....I'm not expecting another $5,000+ day! Let's take what we can get and not get greedy.
0 Comments
Your comment will be posted after it is approved.
Leave a Reply. |
Archives
November 2025
AuthorScott Stewart likes trading, motocross and spending time with his family. |


