|
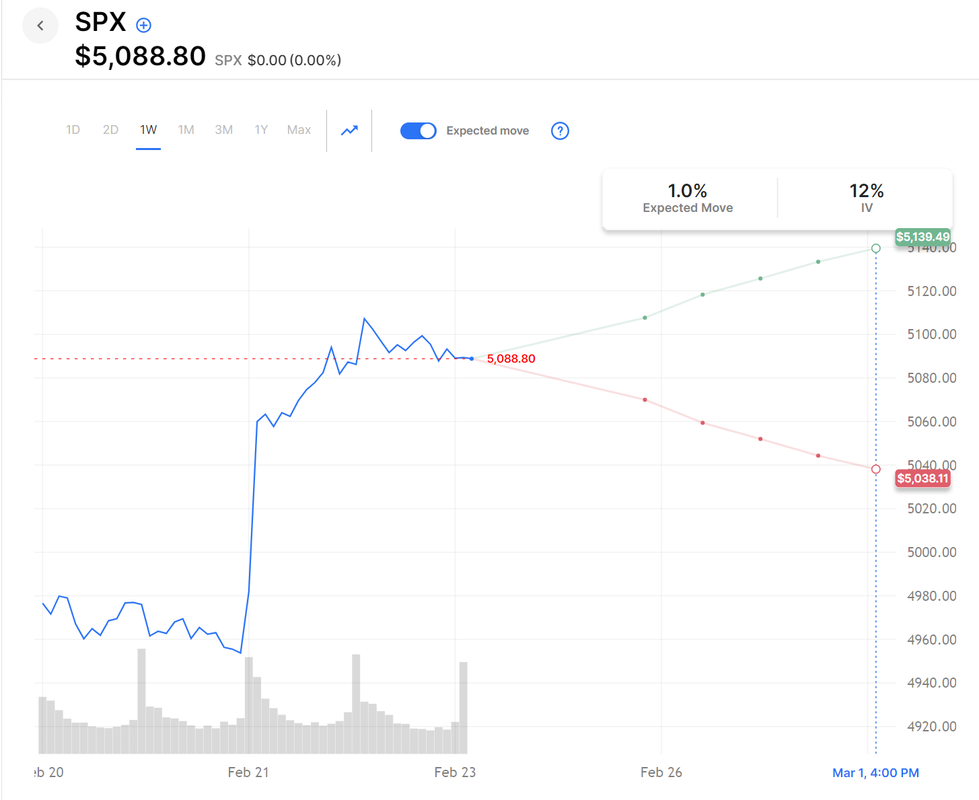
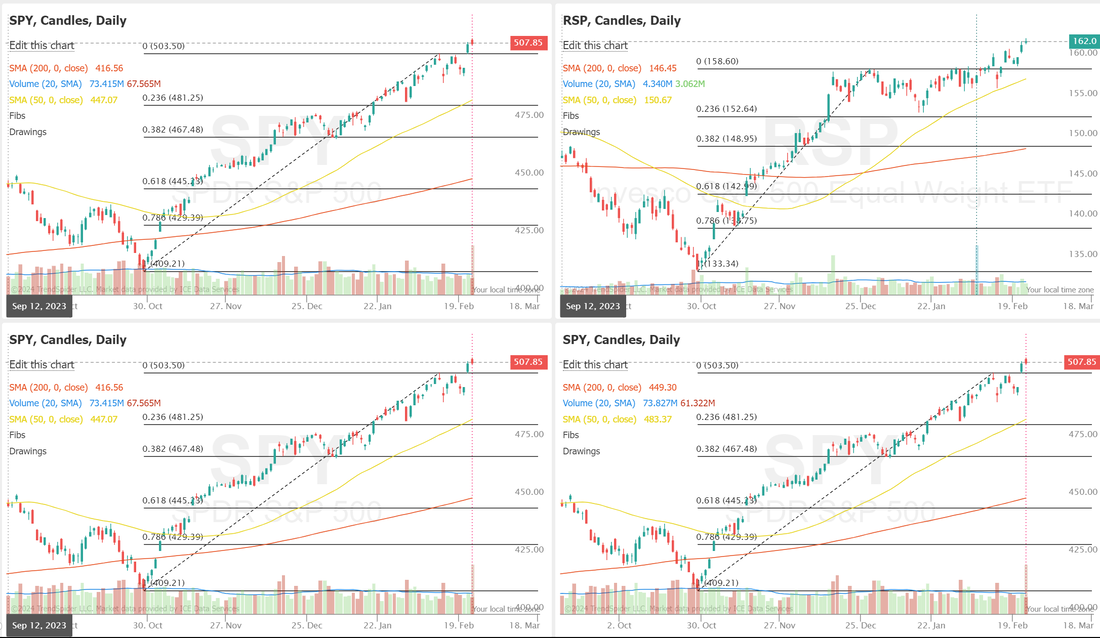
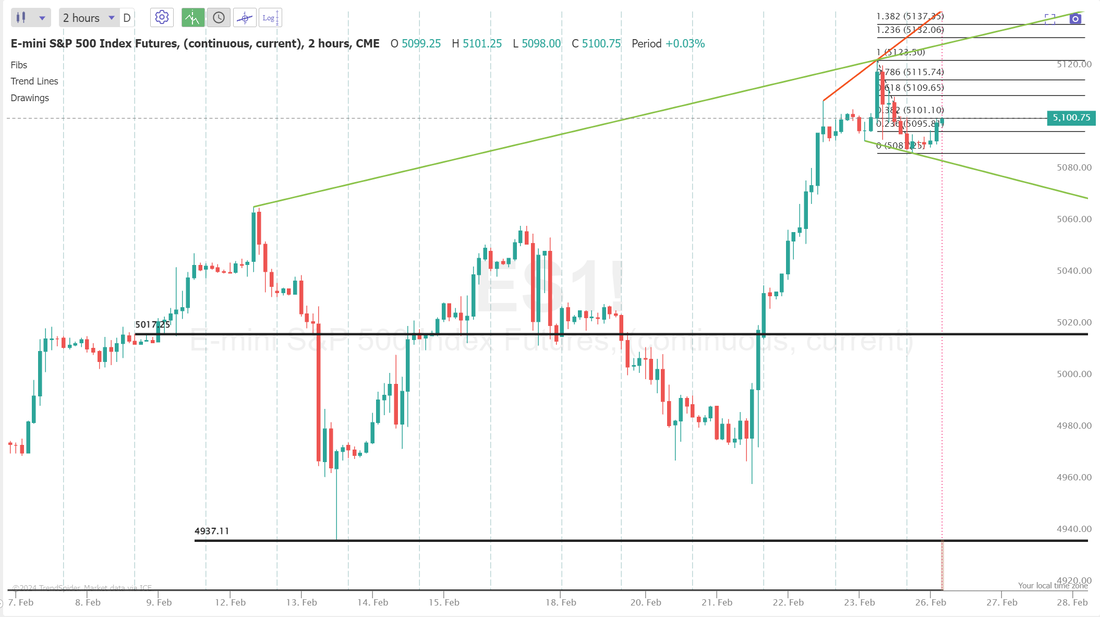
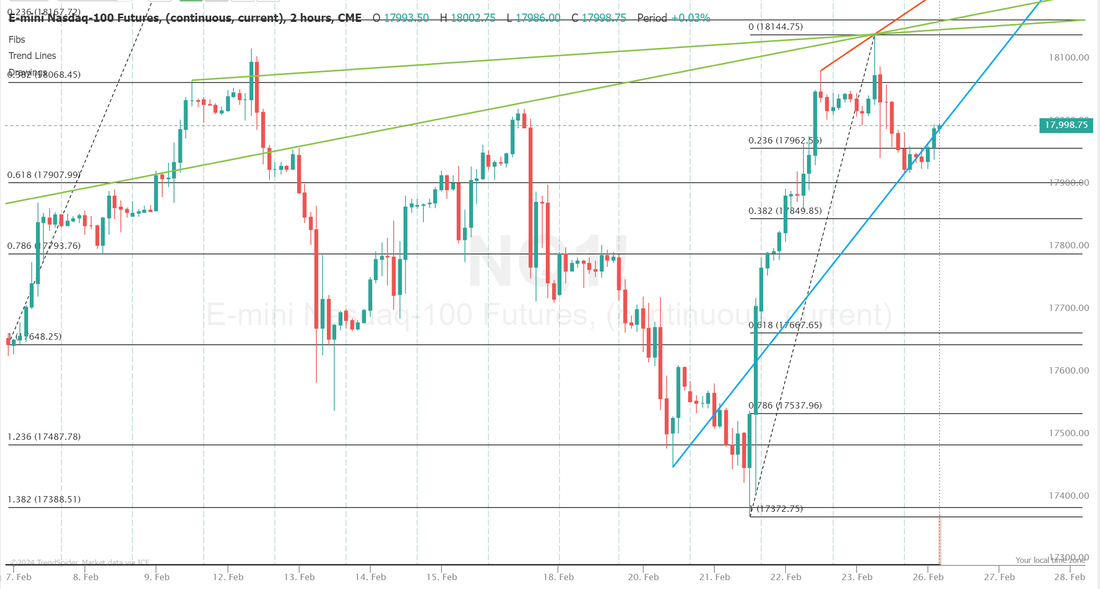
Welcome back to a new week of trading! We finished strong on Friday with a solid, overall day. I needed to be careful with my buying power last week as we awaited the NVDA results so most of my normal positions were small. We have that buying power back this week so it should be business as usual. Mondays are busy for us regardless. The potential trade docket for today is long and we may not get them all done today. /NG, /HG, BA Dragonfly, /MCL, /ZN, PYPL, PLTR, RUT?, FSLR, WYNN, GLD, DIA, DWAC?, /ZC?, VTI, SPY/QQQ, NVDA?, IWM, MSTR, RIVN, Event contract 0DTE, SPX/NDX 0DTE's, CVNA and potential earnings trade setups on ZM, U, LOW. Here's a list of the major, pre-planned economic news catalysts that could be market movers. We had some inflation data and FED speak this week. Monday 26th February 10:00 ET US New Home Sales for January New home sales refer to the number of newly constructed homes that have been sold during a specific time period, typically reported monthly in the United States. This data insights into the overall health of the housing market and can indicate trends in consumer confidence and economic growth. What to Expect Although this data is unlikely to garner a market reaction, rising sales often stimulate job creation and economic expansion, while declines may indicate broader economic challenges or shifts in market conditions. Tuesday 27th February 08:30 ET US Durable Goods January Prelim US Durable Goods represents the change in the value of orders for durable goods from domestic manufacturers in the United States. This economic indicator, reported by the US Census Bureau, serves as a gauge of short-term fluctuations in business investment. Positive changes signify increasing orders, reflecting potential economic growth and heightened confidence among businesses, while negative changes may indicate declining demand or economic uncertainty. What to Expect Greater than expected US Durable Goods data could result in dollar strength and US stock weakness, as this suggests that demand for durable goods could be ignoring the effects of monetary policy from the Fed, and may have implications for other areas of the economy. However, if it comes in lower, that could mean, durable goods is reacting how policymakers desire. 10:00 ET US Conference Board Consumer Confidence for February US Consumer Confidence measures the optimism or pessimism among consumers about the overall economic conditions and their personal financial situations. Compiled and released by the Conference Board through consumer surveys, the index comprises two key components: the Present Situation Index, reflecting current perceptions of economic and employment conditions, and the Expectations Index, indicating consumers’ outlook for the short-term future. A higher index generally signals increased consumer optimism, potentially leading to higher spending, while a lower index may suggest heightened pessimism and potential decreases in consumer spending. What to Expect Considering the current position of the US economy, traders must weigh two scenarios when assessing this data. Lower-than-expected data could indicate consumers are spending less than they otherwise would, potentially helping inflation’s downward trend. Conversely, if sentiment turns out to be higher than expected, this may indicate that consumers are content about the financial climate, which could aid a soft landing. Wednesday 28th February 08:30 ET US GDP Q4 Second Estimate US GDP refers to the Gross Domestic Product. GDP is a key indicator of the economic health and performance of a country and represents the total value of all goods and services produced within the country’s borders during a specific period. The fourth-quarter GDP figure provides insights into the growth rate or contraction of the economy during the final three months of the year. It’s an essential data point for policymakers, economists, and investors, offering information on overall economic activity, consumption, investment, government spending, and net exports. What to Expect Although a strong GDP figure will help cement a soft landing it could also have negative implications for monetary policy. Market participants will need to balance out these risks when assessing what this data means for US stocks and the dollar. 10:30 ET Weekly EIA Crude Oil Inventories The US Weekly Energy Information Administration Crude Oil Inventories report provides information on the total stockpile of crude oil in the United States. It includes data on the changes in crude oil inventories, indicating whether there has been an increase or decrease in the amount of oil held in storage. This report assesses supply and demand dynamics in the oil market and can influence oil prices. What to Expect A significant buildup in inventories may indicate oversupply, putting downward pressure on prices, while a decline may suggest increased demand, potentially impacting prices in the opposite direction. Thursday 29th February 08:30 ET US PCE Price Index for January The US Personal Consumption Expenditures Price Index is a measure of inflation that tracks changes in the prices of goods and services purchased by consumers throughout the US. It is released monthly by the Bureau of Economic Analysis and is considered a key indicator of inflationary trends. The PCE Price Index is closely watched by policymakers at the Federal Reserve, as it helps them assess whether inflation is rising or falling relative to their target. Unlike other measures of inflation, such as the Consumer Price Index (CPI), the PCE Price Index includes data on personal consumption expenditures, which covers a broader range of goods and services and is based on more comprehensive data sources. The basket of goods measured in the PCE report is also variable based on consumer spending habits, making it a better representation of how much more consumers are actually spending on their shopping and services. What to Expect Higher-than-expected inflation indicates that the Fed may need to keep rates higher for longer to bring inflation sustainably back to its 2% target, which would be likely to cause markets to pull back their bets on Fed rate cuts this year. This would cause strength in US stocks, and weakness in the dollar. US Weekly Initial & Continued Jobless Claims The US Initial Jobless Claims report provides data on the number of individuals who filed for unemployment benefits for the first time during the previous week. It serves as an indicator of the labor market’s health, with higher numbers indicating increased layoffs and economic instability, while lower numbers suggest a stronger job market. Continued Jobless Claims, on the other hand, represent the number of individuals who remain on unemployment benefits after their initial claim. What to Expect Employment is one of the Fed’s mandates, however, FOMC officials have mentioned that they do see a higher unemployment rate being in line with their goal back to 2% inflation. This means that Jobless Claims coming in higher than expected, suggesting higher unemployment, would be likely to be read by the Fed as good news for inflation’s return to target. This scenario could cause US stocks to strengthen and the dollar to weaken. Friday 1st March 09:45 ET US S&P Manufacturing PMI February Final The US S&P Manufacturing Purchasing Managers’ Index is an economic indicator that measures the performance of the manufacturing sector. It provides insight into factors such as new orders, production levels, employment, supplier deliveries, and inventory levels. As a diffusion index, a reading above 50 indicates expansion in the sector, while a reading below 50 suggests contraction. The S&P Manufacturing PMI is based on a survey of purchasing managers in the manufacturing industry. What to Expect The markets still seem to think that ‘good news is bad news’ with this report, though it has less weight than its counterpart (The ISM Manufacturing PMI, detailed below) Nonetheless, this means that if the manufacturing PMI comes in above expectations, especially in expansionary territory (50+), then stocks are likely to weaken, and the dollar is likely to strengthen. This is because it is seen as an upside inflation risk, as it indicates there is still strong demand for manufactured goods, despite high interest rates. 10:00 ET US ISM Manufacturing PMI for February The US ISM Manufacturing Purchasing Managers’ Index measures the economic activity and sentiment of manufacturing sector managers. It assesses factors like new orders, production, employment, supplier deliveries, and inventories. The index is compiled from a survey of purchasing managers as a diffusion index, with a reading above 50 indicating expansion and below 50 indicating contraction. The US S&P Manufacturing PMI also measures manufacturing sector activity but uses a different methodology and survey structure. While both PMIs aim to gauge the health of the manufacturing sector, they may differ in their coverage, sample size, and methodology, leading to variations in the reported figures. What to Expect The markets still seem to think that ‘good news is bad news’ with this report. This means that if the manufacturing PMI comes in above expectations, especially in expansionary territory (50+), then stocks are likely to weaken, and the dollar is likely to strengthen. This is because it is seen as an upside inflation risk, as it indicates there is still strong demand for manufactured goods, despite high interest rates. University of Michigan Sentiment February Final The University of Michigan Consumer Sentiment Index, often referred to as the Consumer Sentiment Index or just Consumer Sentiment, is a widely followed economic indicator that measures the confidence of American consumers in the state of the economy. It is based on a survey conducted by the University of Michigan, which gathers data on consumers’ attitudes and expectations regarding their personal finances, business conditions, and overall economic outlook. The index is released monthly and is considered a leading indicator of consumer spending, as confident consumers are more likely to spend money on goods and services, driving economic growth. What to Expect Consumer sentiment is closely watched by markets to assess consumer resilience in a high-interest-rate environment. Elevated sentiment may suggest strong demand, potentially leading to inflationary pressures, but it could also signal consumer resilience, reducing recession fears. In this release, the market focus is on the 1 & 5-year inflation expectations accompanying the sentiment data. Higher inflation expectations may delay Fed rate cuts, affecting US stocks negatively and strengthening the dollar. The expected move on the SPX for the week is 1% and 12% I.V. Not very conducive to option sellers and certainly makes it difficult for us to get back on our daily Theta Fairy trades. This gives us roughly a 100 point trading range target for the week. We have a few earnings trade potential setups today. ZM, U, LOW and also FSLR may provide entries for us today. As you can see, most of the indices we trade and track are at or near all time highs. However, on the /ES futures we are stuck in a tight range around 5,100 and have been since the 22nd. On the /NQ we are lower than we were back on Feb. 12th. There's some decent overhang here. We'll have to see if the bulls can continue the push higher. The resistance levels here are real and it would be impressive if they could turn resistance into support. Intra-day levels for me:
/ES: 5110/5115/5123/5132 to the upside. 5095/5087/5075/5065 to the downside. /NQ: 18111/18270/18380/18523 to the upside. 17920/17850/17699/17587 to the downside.
0 Comments
Your comment will be posted after it is approved.
Leave a Reply. |
Archives
December 2025
AuthorScott Stewart likes trading, motocross and spending time with his family. |


