|
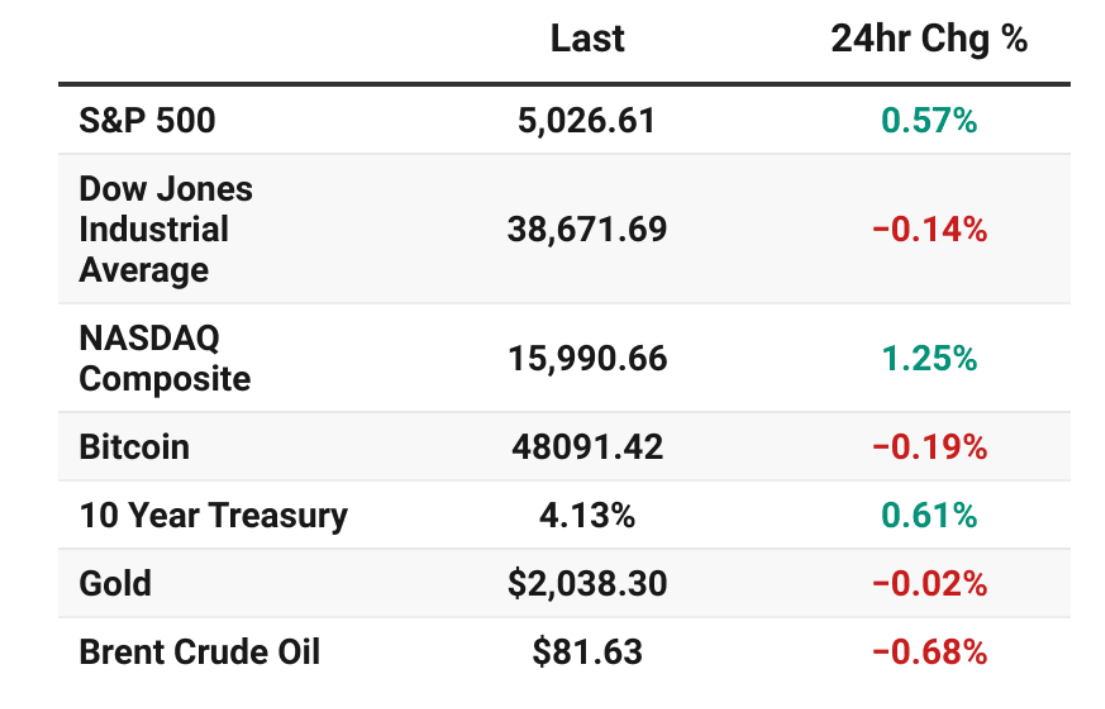
Welcome back to a fresh new week of trading! Mondays are usually our busiest day of the week as we set up our weekly strategies. We have /ZN, /MCL, /MNQ, DAL?, DIA, DWAC, FSLR, GLD, GOOG, IWM, MSTR, NDX/SPX 0DTE's, NVDA, PFE?, PLTR, PYPL, WYNN, SPY/QQQ 4DTE's, RUT all on the trade docket today. Price action from Friday was muted with the NDX being the big mover:
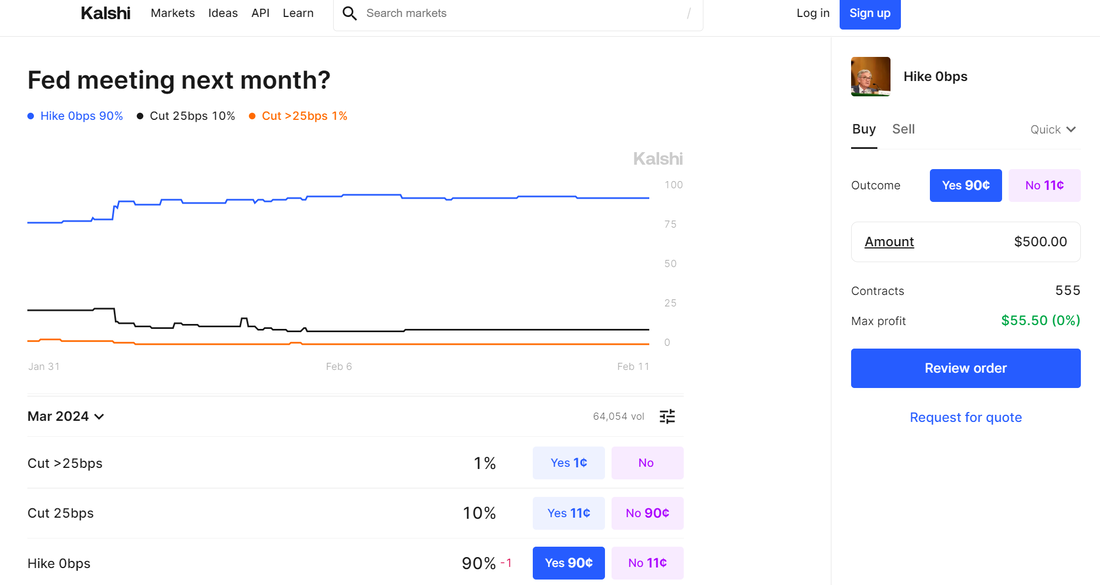
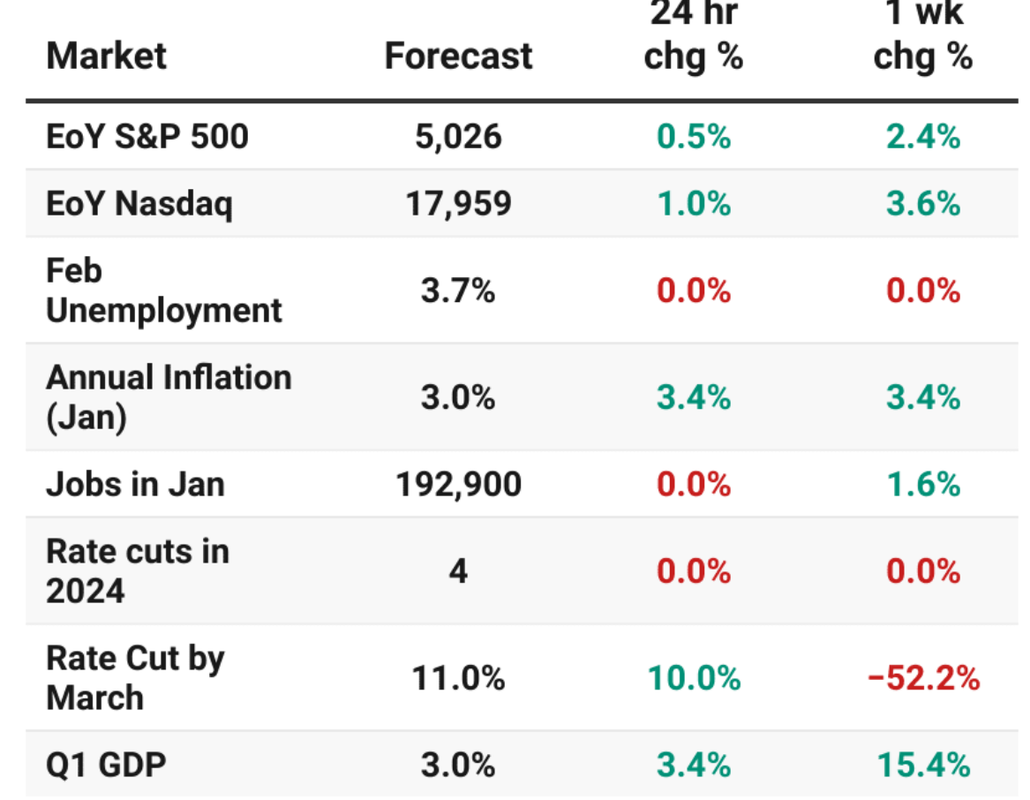
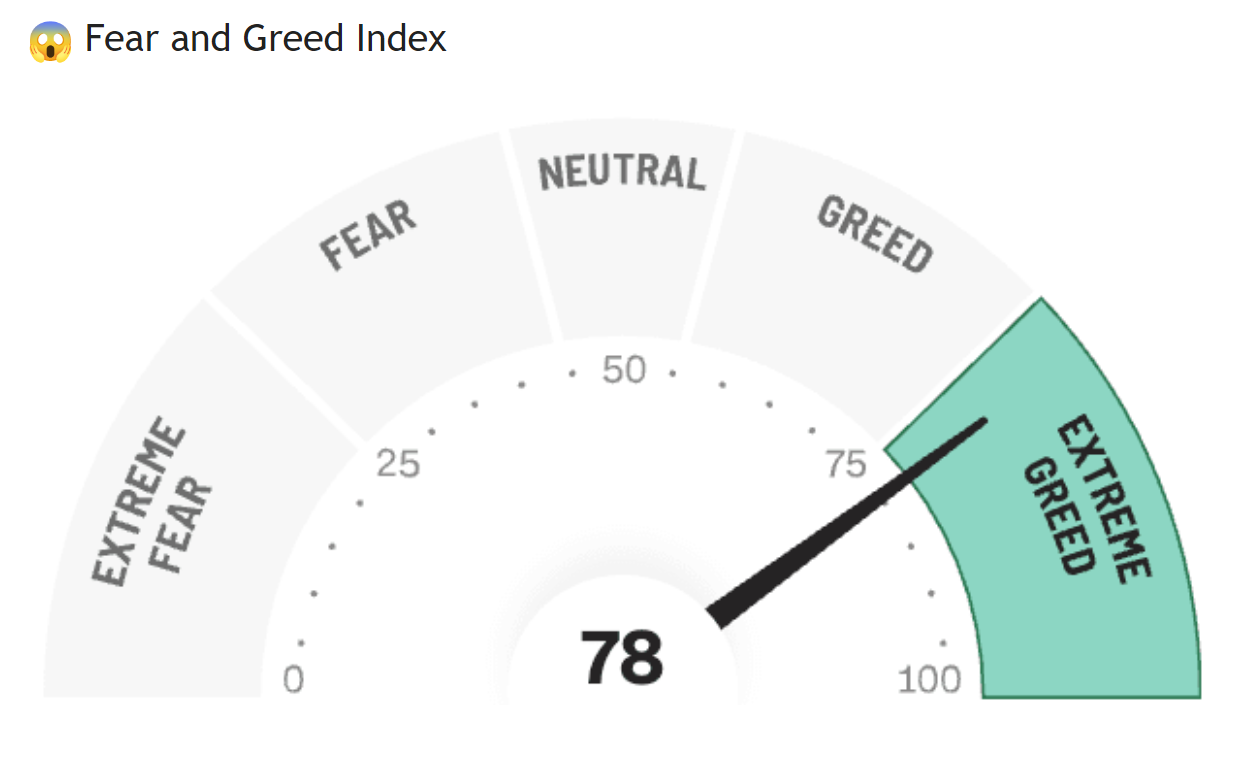
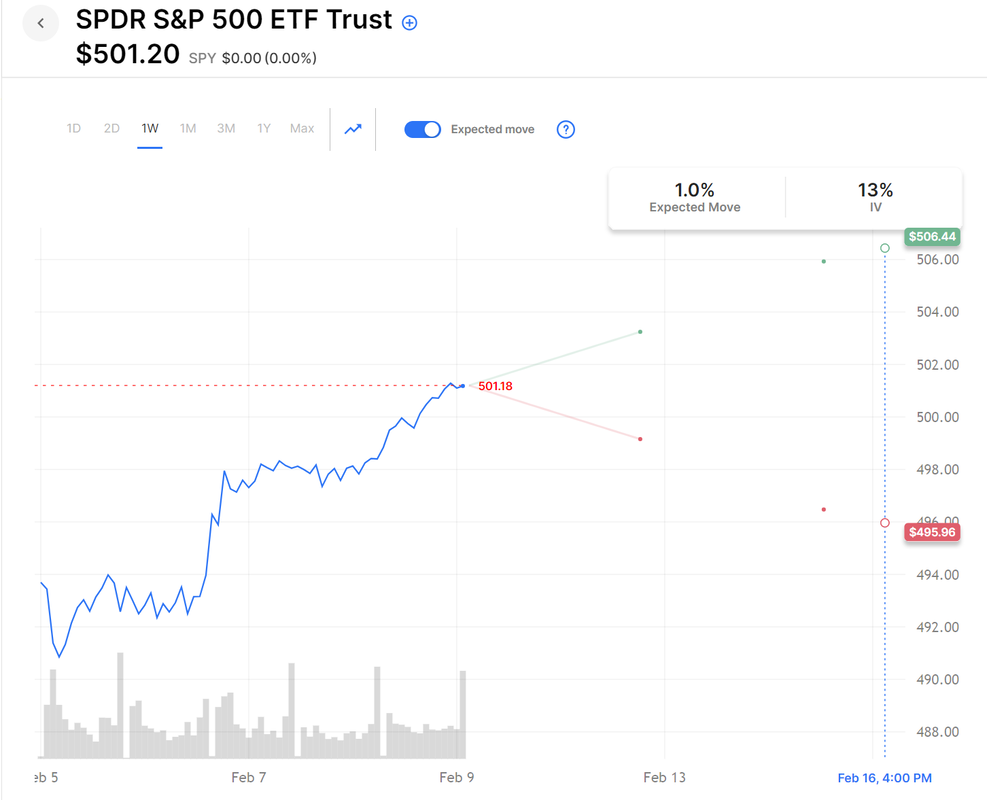
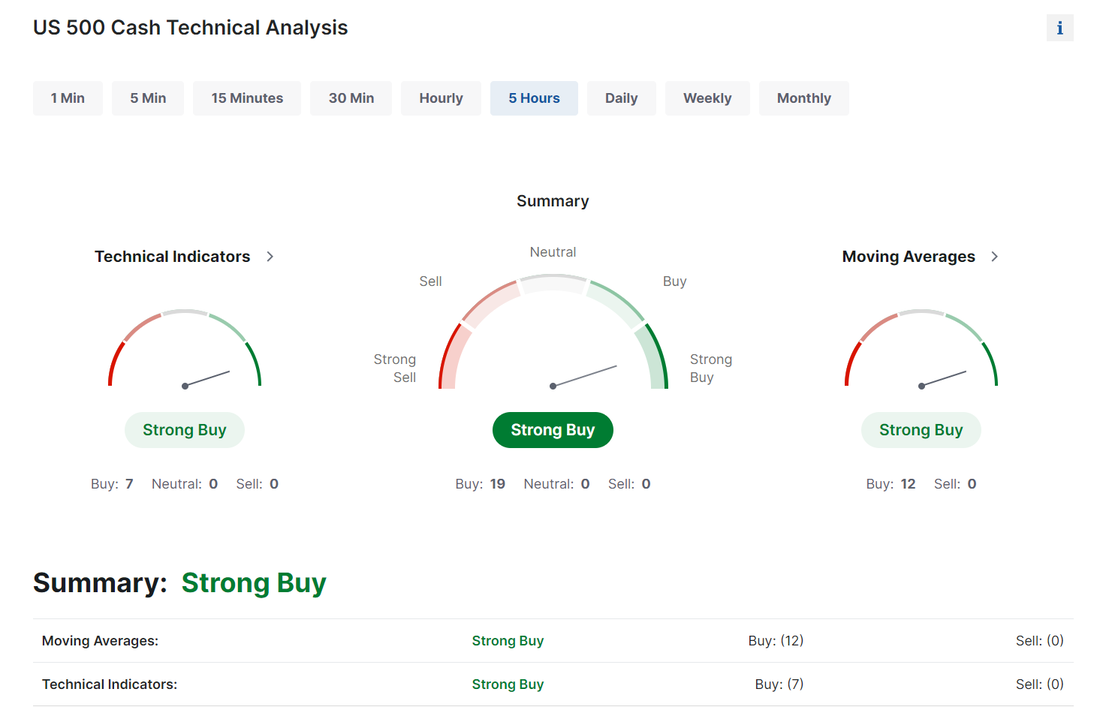
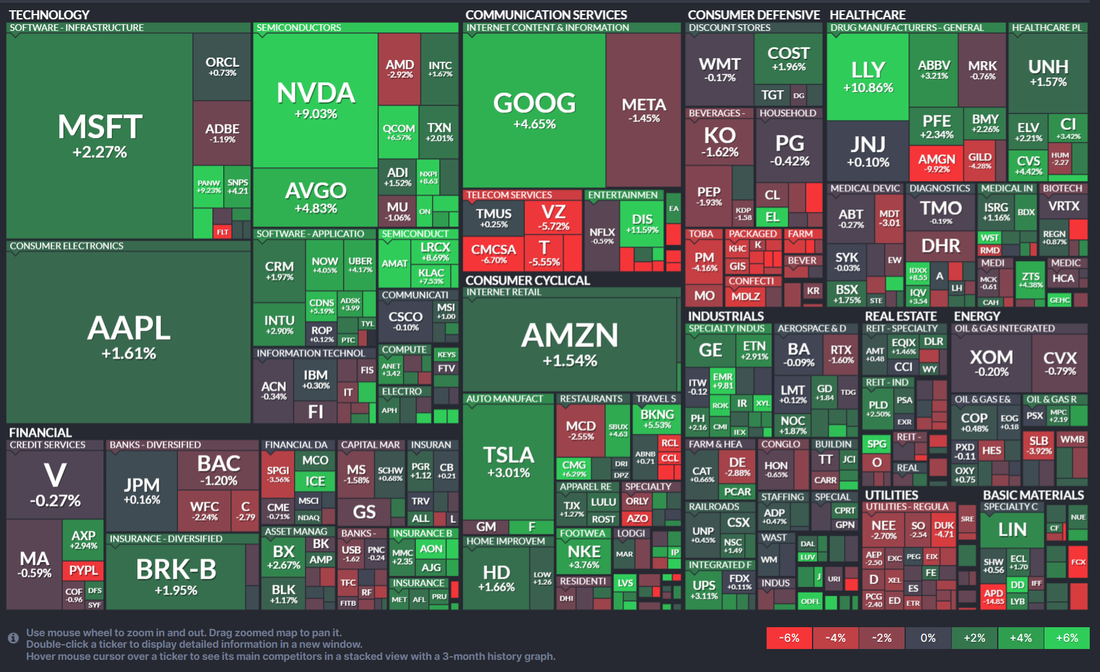
We talk alot about looking for trades that have "edge" in them. 21% of traders still think the Fed will cut rates in March. The event contracts we trade through Kalshi is much closer to reality with just a 10% chance. We will be setting this trade up today. If you'd like to trade one of the best platforms out there (IMHO) that can help you create "edge" then check it out. Sign up is free. Here are some of the positions we are looking at taking: The market sure looks healthy right now but... the old mantra of "buy when blood runs in the street and sell when everyone is making money hand of fist" makes us cautious here. For this week we are looking at a 1% Implied move in SPY and 13% I.V. Just plain, downright horrible for credit sellers! Earnings season continues and we've got a few underlyings we will be looking to trade today: While the market internals are all still solidly bullish... There is a divergence starting to appear with more and more stocks dropping below their 50-200DMA If you are a "reversion to the mean" type trader you may want to look at a pairs trade on Tech and Utilities. Last weeks price action saw Tech scream higher and Utilities got pretty beat up. One very interesting aspect of Techs surge (and the SPX in general) is NVDA. It's massive surge this year accounts for a full 1.25% of the SPX total YTD return of 5%. NVDA has earning coming up and if the past is a predictor of the future, we'll see a pop or surge out of earnings...then a retrace. The indices are "priced to perfection" right now. It wouldn't take much to flip directional bias. Let's take a look at some technicals: Finding nearly perfect support at the 1.618 Fibonacci extension, the SPY closed at $501.20 (+1.38%) and logged the strongest weekly RSI reading it has seen since September 2021. After several weeks of struggling to break away from the top of the ascending channel, the QQQ ETF managed to turn this previous resistance into support, pushing powerfully through the 2.0 Fibonacci extension and closing the week at $437.05 (+1.88%). Closing at $199.34 (+2.56%), the IWM continues to flash signs of late-stage Wyckoff accumulation, finding support at the 200-Wk SMA, putting in a higher low at the last point of supply and breaking out of the flag pattern it has been in since the beginning of the year. We just finished up five full weeks of gains for the market. Can it make it 6 this week? The run looks strong but every run, including this one, takes a pause in best case and retraces in worst case. The longer we hold the uptrend, the bigger the % sell of becomes.
Intra day levels for me: /ES: 5046/5055/5067/5075 to the upside. 5038/5031/5021/5013 to the downside. /NQ: 18068/18167/18330/18377 to the upside. 18006/17965/17899/17793 to the downside.
0 Comments
Your comment will be posted after it is approved.
Leave a Reply. |
Archives
November 2025
AuthorScott Stewart likes trading, motocross and spending time with his family. |
