Movement finally?Traders just want movement, any movement. Down is better than up for size of moves and premium but up is good too. We just need something to happen. That hasn't been the case for a week. Yesterday finally brought some action. Hopefully we will break out and start the next wave of directional bias. We finally got a profit on our SPX 0DTE yesterday. It was a pretty easy day and we stayed in the green all day. I wasn't quite as good on execution with scalping. I really just needed to stay short all day and it would have been lovely. Here's a look at my day: 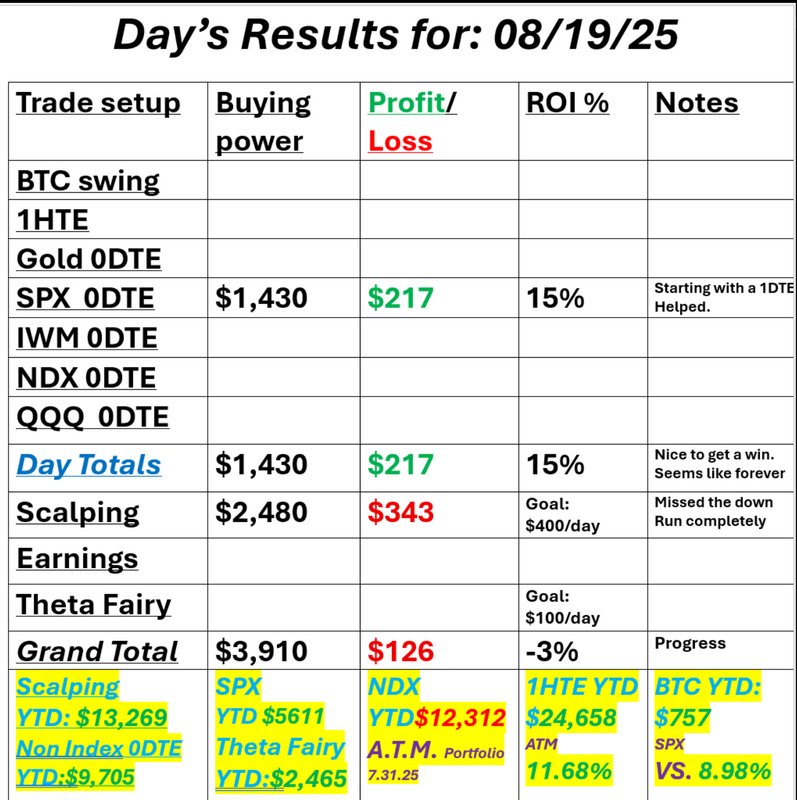 Let's take a look at the markets: We start the day with a sell signal. 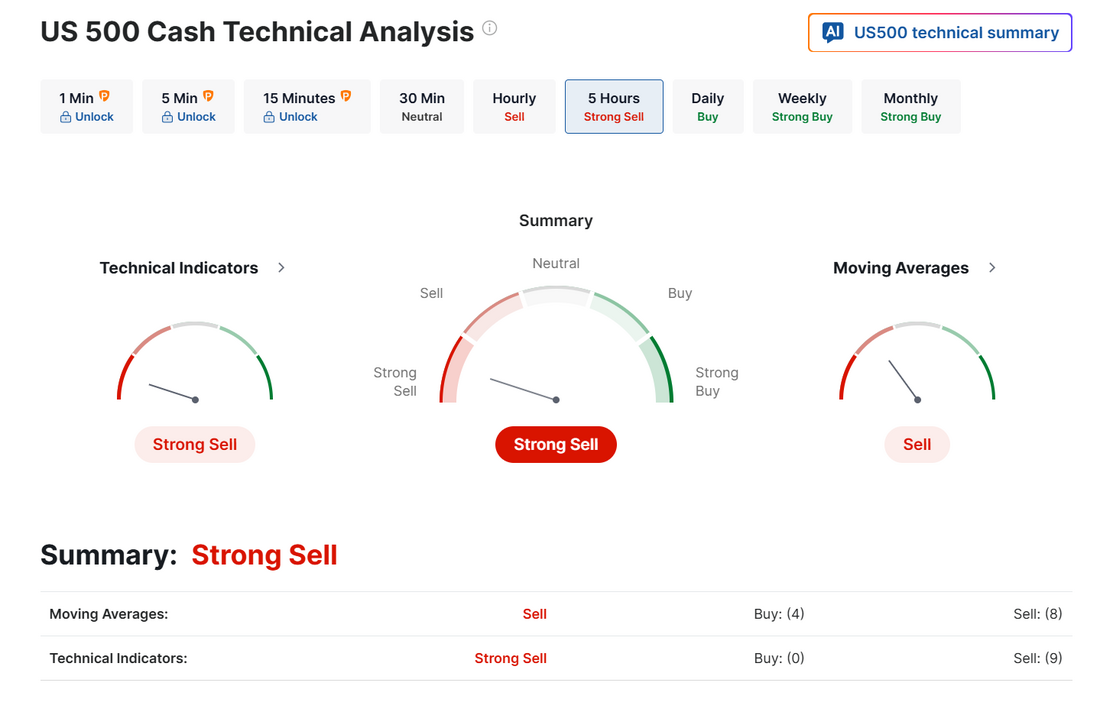 This weakening trend is starting to take hold. 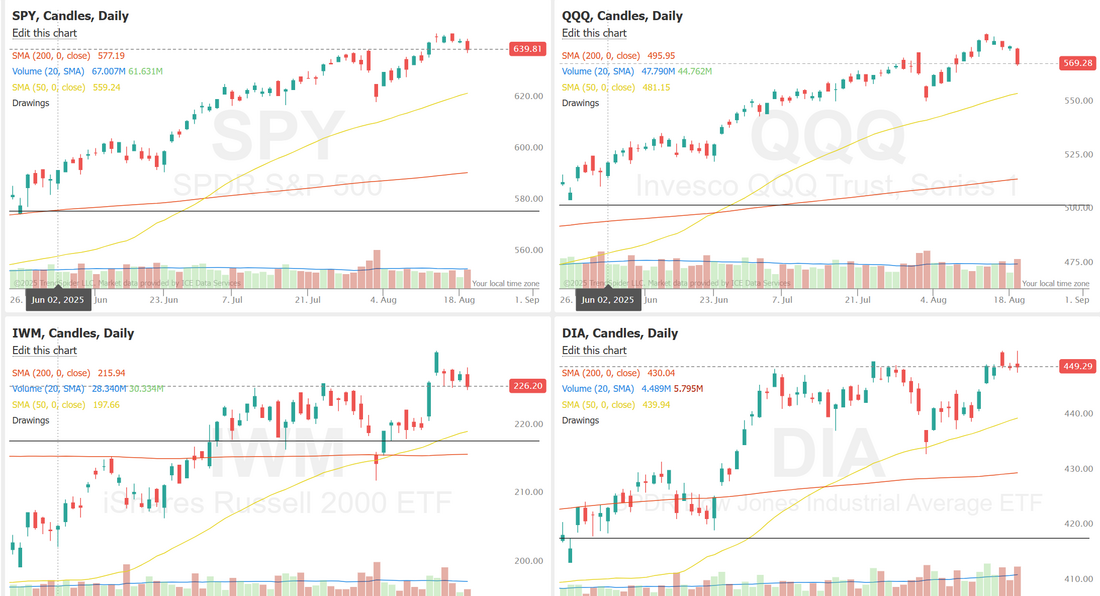 The option smile is interesting as we see a decent sized ramp up in put tail risk coverage. 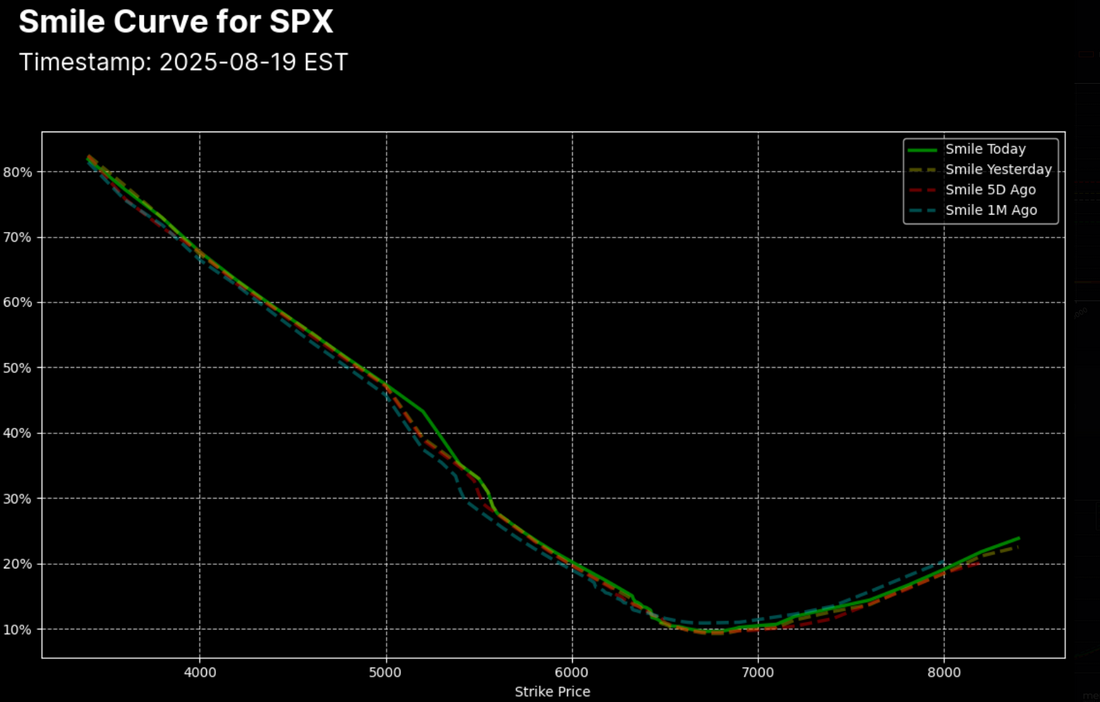 The SPX chart from the Vol Control Fund Model shows that short-term realized volatility (1M) has continued to trend lower after the elevated levels seen earlier this year, now converging toward the 3M realized volatility. The decline in realized vol has also been mirrored by the volatility ratio, which is coming off its mid-year highs and now moving closer to its longer-term mean. This cooling of volatility suggests the market is in a more stable regime compared to recent months. In the short term, the spot price remains near highs, and the key watchpoint is whether the volatility ratio continues to compress further, which could reinforce steady price action, or if it begins to rebound, signaling a potential pickup in movement. 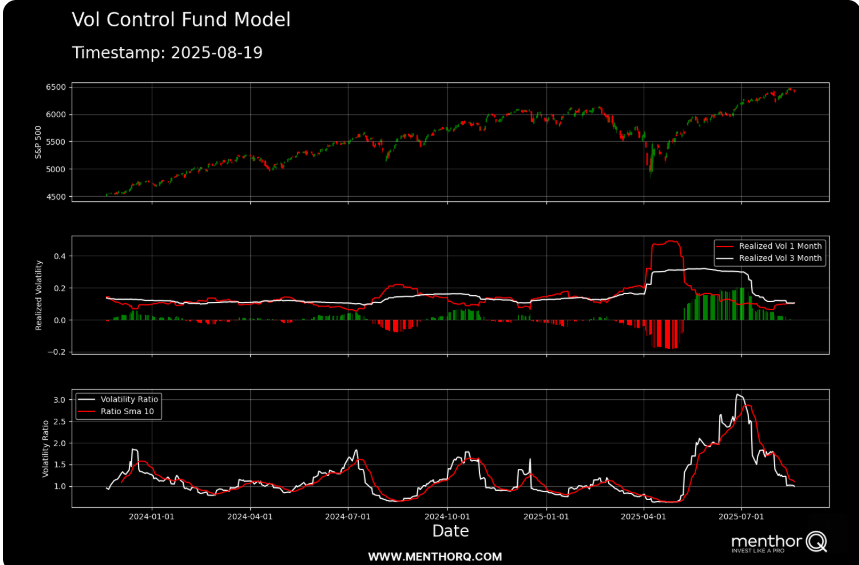 The latest NDX liquidity snapshot highlights a short-term pullback, with price down -1.39% to 23,385 while maintaining a bullish momentum backdrop. Despite the drop, gamma remains in a positive regime, which can help dampen further downside volatility. Implied volatility (16.2%) has jumped nearly 9%, widening the gap over realized volatility (12.1%) and suggesting increased demand for protection. The put/call open interest ratio at 1.15 indicates relatively balanced positioning, while the IV rank of 7% shows that current vol levels remain low compared to historical extremes. Overall, the setup reflects short-term pressure within a still supportive gamma and momentum environment, with volatility dynamics worth monitoring closely in the near term. 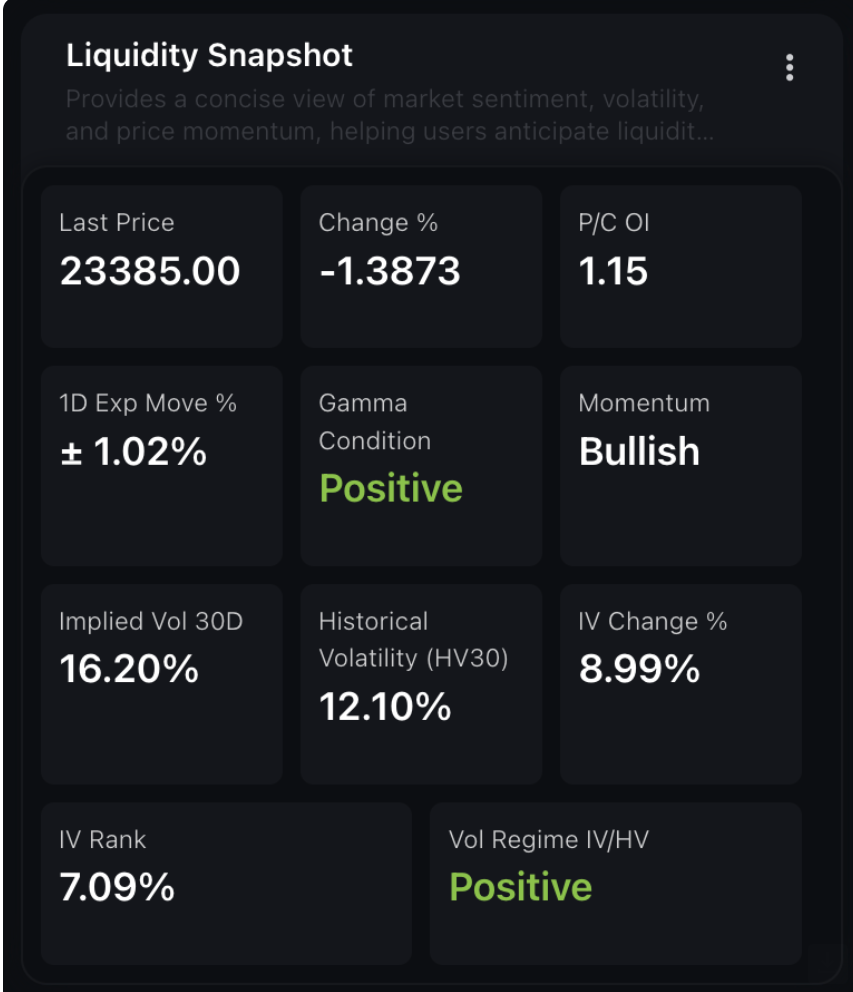 Looking at the VTI ( I think it gives the best "overall" view of the market) it's a pretty clear sell signal here. 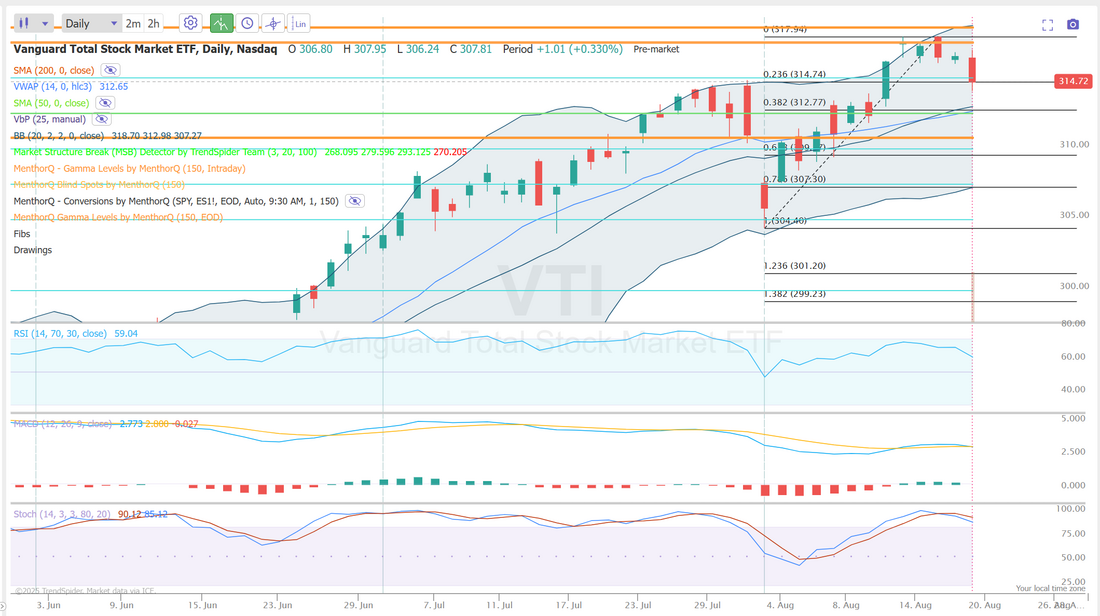 My lean or bias today is bearish. That's how everything is leaning. We've got FOMC minutes release today but I don't think it changes sentiment. Feels good to get back on the bear train!  The heat map for the week shows tech starting to roll over. What leads us up usually leads us down. 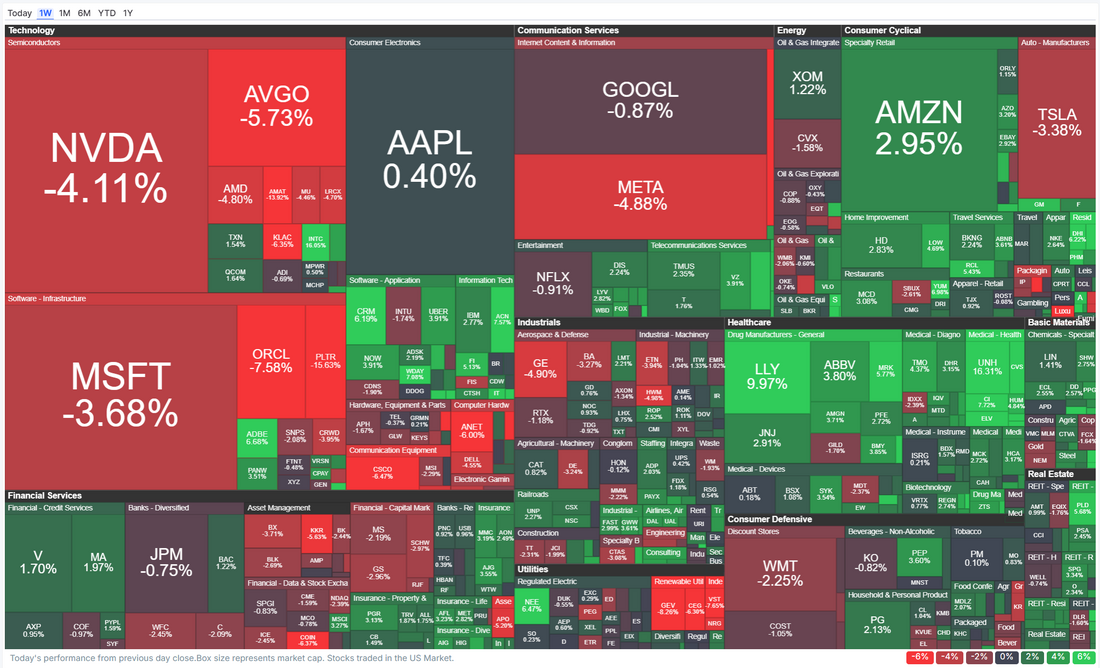  We haven't taken a look lately at one of the biggest economic drivers in the economy. That's real estate. For the first time in history, a NEW home in the US costs $33,500 LESS than an EXISTING home, per Reventure. Not even June 2005 saw such a large gap, right before the 2008 Financial Crisis. 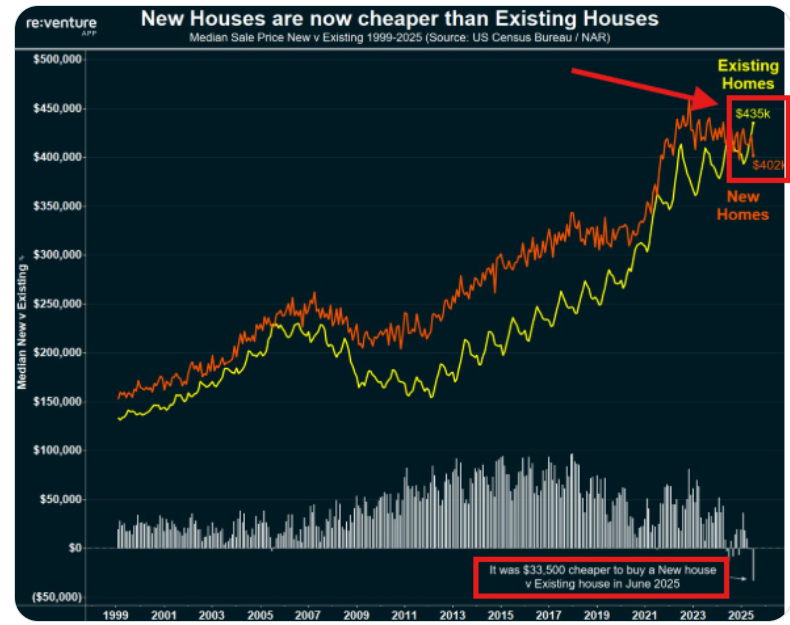 Is real estate due for a correction? "Experts" have been calling for one for over a year. Who knows but we do know the saying "As residential real estate goes, so goes the economy" has been true, over time.   Trade docket for today: Gold still lacks premium and BTC is still to volatile for any 1HTE entries so I'll stick with our SPX 0DTE and scalping using the /mnq futures or QQQ options. There should be enough potential in those two to achieve our $1,000 profit goal IF...we can execute. Let's take a look at the intra-day levels on /ES: Lot's of great levels to watch today. 6434, 6450, 6454, 6462 are new resistance zones. 6409, 6400, 6384, 6380 are new support zones. 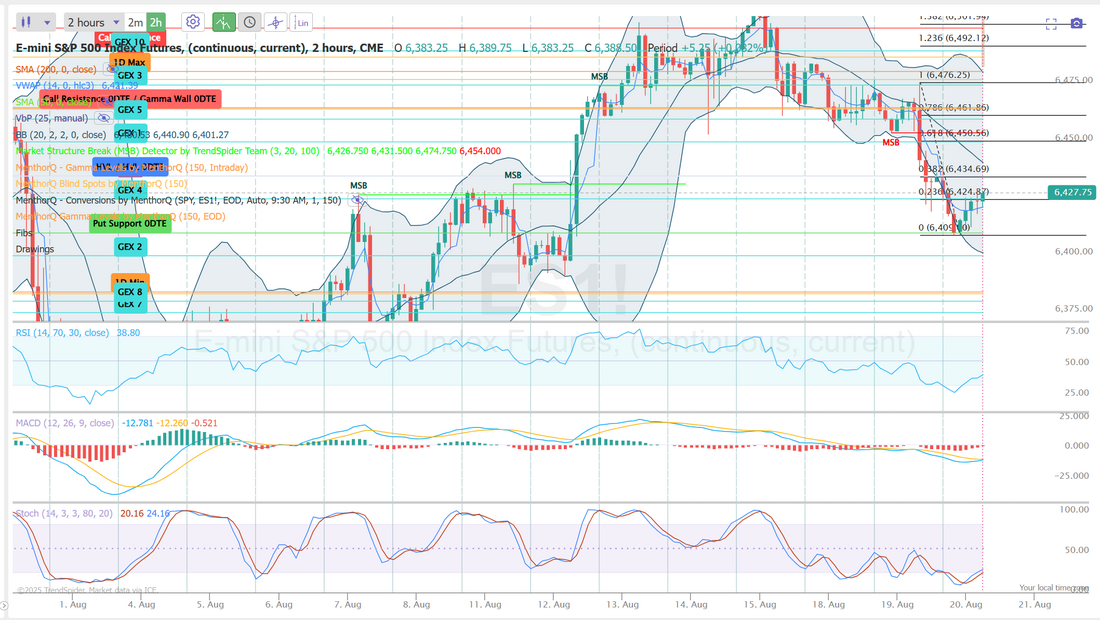 We've lacked opportunity lately in the market. I think today could open that back up. I look forward to seeing you all in the live trading room.
0 Comments
Your comment will be posted after it is approved.
Leave a Reply. |
Archives
November 2025
AuthorScott Stewart likes trading, motocross and spending time with his family. 
|