|
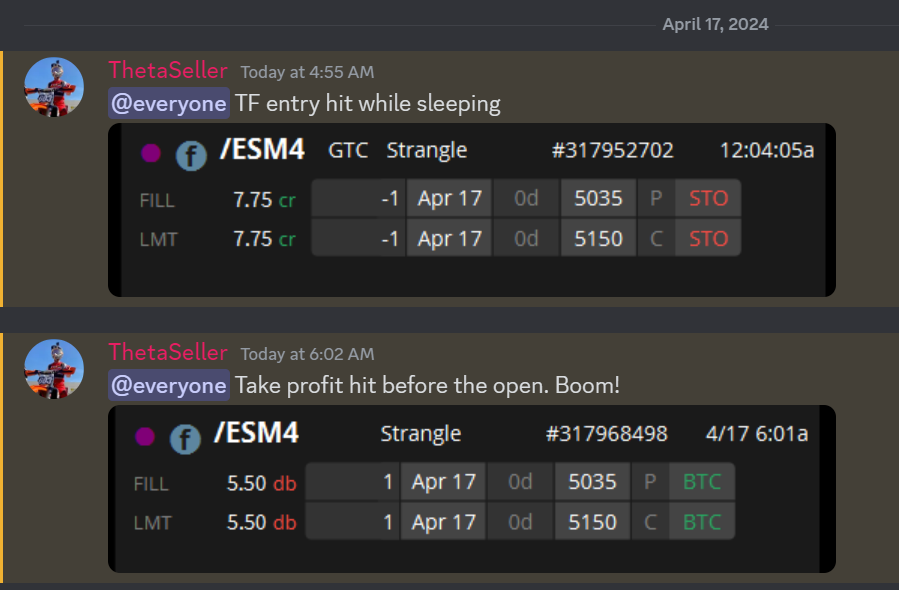
It's been a volatile few days of trading for me. Up 14k on Friday. Down 12k on Monday and yesterday we popped for over 17K! $17,408 bump in my net liq to be exact. We are now offically, on our documented trades, over $100,000 dollars in profits from our FOUR daily 0DTE setups. We deploy an average of 15K a day to generate that. Our scalping program is still on track for $50,000 of income this year with 5K of capital deployed. There are no guarantees in the market but I'd like to think our results speak for themselves...Just ask our members. Yesterday was big for our NDX 0DTE. $12,000 of profit on $10,000 of capital. Our SPX yielded $350 profit on $2,000 of capital and our Event contract NDX hit for $300 profit on $940 of capital...an 18% ROI. Agian, no guarantees in the market but we try really hard to find opportunities to yield us $1,000+ a day of potential gains. NVDA helped out as well with a nice $1,900 improvement to the net liq. We doubled our money in our NDX butterfly. I was so focused on it, I forgot our UAL earnings trade! We'll make up for it today with three new earnings setups. We were able to get another Theta Fairy trade working last night. The entry hit while I was asleep and, as I type this, our take profit just hit. The I.V. is there, at least for this week to keep generating setups. Our trade docket for today is fairly light: CCI, AA, SLG potential earnings setups. /HE, /MCL, DJT, IWM, SPX/NDX/Event contracts on NDX and Bitcoin 0DTE's. LULU, TSLA. Lets take a look at the markets: It's been a while since we've not been in full "risk on" mode. Technicals are still bearish. Indices are now decidedly in a bearish pattern. Having all broken down below their respective 50DMA and headed, it looks like, to the 200DMA. The index that might be the most telling, and also possibly the best "overall" indicators of market health is the VTI. Our bearish swing trade on it this month turned out well. We'll need to reset this trade next week. Will next months setup be bullish or bearish? Hard to tell right now but the bears now seem to be in charge. The only pre-planned news catalyst we have today that should effect us is oil inventory numbers. 10:30 ET US Weekly EIA Crude Oil Inventories The EIA Crude Oil Inventories report provides information on the change in the number of barrels of crude oil held in inventory by commercial firms in the United States over the past week. It is released by the Energy Information Administration and serves as a crucial indicator of supply and demand dynamics in the oil market. Traders and investors monitor this report as it can influence crude oil prices and impact various sectors of the economy, including energy companies, transportation, and manufacturing. What to Expect Increases in crude oil inventories may indicate oversupply conditions, which could put downward pressure on oil prices. Conversely, decreases in inventories may suggest tightening supply conditions and potentially support higher oil prices. We started the week off with a short oil posiiton with a covered put, which looks like its producing results. My market lean today is neutral. Intra-day levels for me: /ES; 5109/5130/5161/5183 to the upside. 5091/5079/5068/5042 to the downside. /NQ; 17930/18008/18030/18140 to the upside. 17882/17837/17787/17758 to the downside. Bitcoin; BTC is now sitting on a cliff. It wouldn't take much to send it crashing. 64807 and 66620 are the two closest upside targets. 61944 is current support. A break below that and it could be, "look out below". Have a great day folks!
0 Comments
Your comment will be posted after it is approved.
Leave a Reply. |
Archives
November 2025
AuthorScott Stewart likes trading, motocross and spending time with his family. |


