|
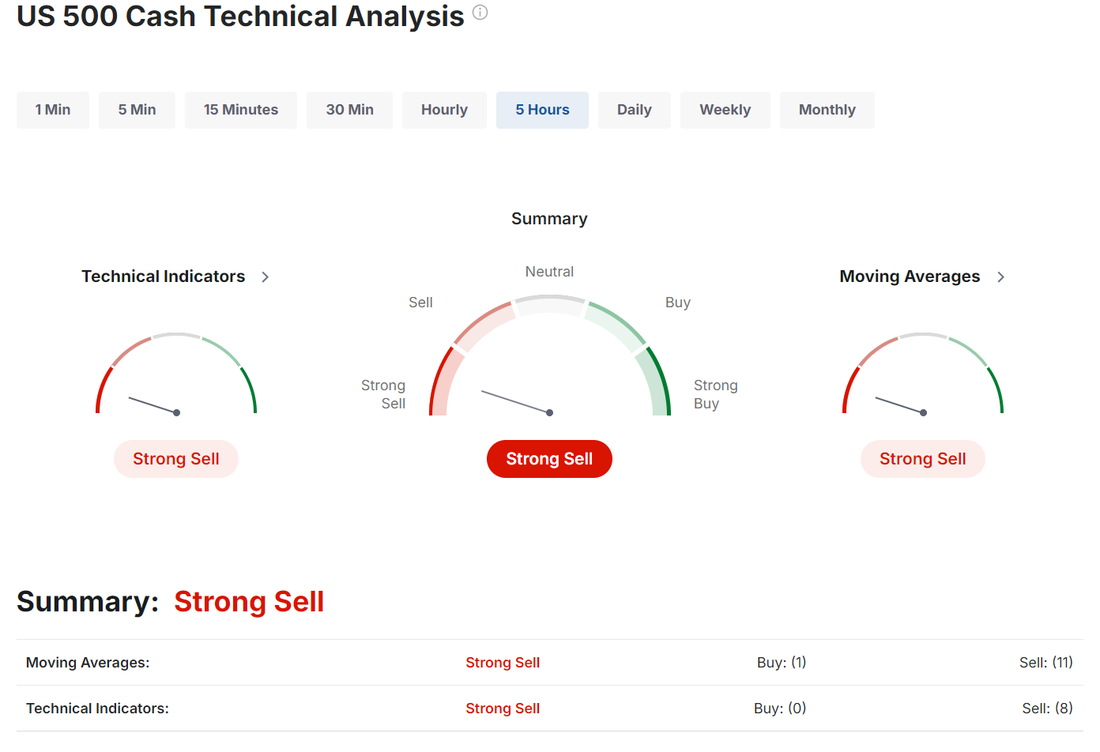
Welcome to Weds. traders. I had another bad day yesterday. That's three in a row for me and starting to get a little old! Here's my results from yesterday. Markets seem to be rolling over here. We went, very quickly from a neutral to sell rating. Maybe most telling is the QQQ which has, once again, broke down below it's 50DMA. September S&P 500 E-Mini futures (ESU24) are down -0.30%, and September Nasdaq 100 E-Mini futures (NQU24) are down -0.46% this morning, extending yesterday’s slump amid worries about a slowing U.S. economy, while investors awaited the latest reading on U.S. job openings. In yesterday’s trading session, Wall Street’s main stock indexes closed in the red, with the benchmark S&P 500 posting a 2-week low and the tech-heavy Nasdaq 100 posting a 2-1/2 week low. Boeing (BA) slumped over -7% after Wells Fargo downgraded the stock to Underweight from Equal Weight with a price target of $119. Also, chip stocks lost ground, with Nvidia (NVDA) sliding more than -9% and Intel (INTC) dropping over -8% to lead losers in the Dow. In addition, U.S. Steel (X) fell more than -6% after Democratic presidential candidate Kamala Harris expressed opposition to the $14.1 billion sale of the steelmaker to Japan’s Nippon Steel, stating that the company should stay domestically owned. On the bullish side, Unity Software (U) gained about +2% after Morgan Stanley upgraded the stock to Overweight from Equal Weight with an unchanged price target of $22. Economic data released on Tuesday showed that the U.S. ISM manufacturing index rose to 47.2 in August, although it fell short of expectations of 47.5. Also, the U.S. August ISM price paid sub-index unexpectedly rose to 54.0, stronger than expectations of a decline to 52.1. In addition, the U.S. S&P Global manufacturing PMI was revised downward to 47.9 in August, marking its first decline in seven months and missing the consensus of 48.0. Finally, U.S. July construction spending unexpectedly fell -0.3% m/m, weaker than expectations of +0.1% m/m and the biggest decline in 1-3/4 years. “The trepidation regarding the recent rise in the unemployment rate will leave the market on edge until Friday morning’s data is in hand,” said Ian Lyngen and Vail Hartman at BMO Capital Markets. “ISM Manufacturing underwhelmed in August. Overall, there wasn’t anything encouraging in the data, but this isn’t particularly new for the U.S. manufacturing sector.” Investor focus this week will center on Friday’s monthly payroll report for August, which is anticipated to reveal that payrolls in the world’s largest economy increased by 164,000, up from 114,000 in July. “This week’s jobs report, while not the sole determinant, will likely be a key factor in the Fed’s decision between a 25 or 50 bps rate cut,” said Jason Pride and Michael Reynolds at Glenmede. Meanwhile, U.S. rate futures have priced in a 61.0% chance of a 25 basis point rate cut and a 39.0% chance of a 50 basis point rate cut at the conclusion of the Fed’s September meeting. On the earnings front, notable companies like Hewlett Packard Enterprise (HPE), Dollar Tree (DLTR), Dick’s Sporting Goods (DKS), Casey’s General Stores (CASY), Copart (CPRT), and C3.ai (AI) are set to report their quarterly figures today. Today, all eyes are focused on the U.S. JOLTs Job Openings data, set to be released in a couple of hours. Economists, on average, forecast that the July JOLTs Job Openings will come in at 8.090M, compared to June’s figure of 8.184M. Also, investors will focus on U.S. Factory Orders data, which arrived at -3.3% m/m in June. Economists foresee the July figure to be +4.7% m/m. U.S. Trade Balance data will be reported today as well. Economists forecast this figure to stand at -$78.80B in July, compared to the previous figure of -$73.10B. Later today, the Federal Reserve will release its Beige Book survey of regional business contacts, which includes anecdotes and commentary on business conditions in each of the 12 Fed districts. The Beige Book is published two weeks before each meeting of the policy-setting Federal Open Market Committee. In the bond market, the yield on the benchmark 10-year U.S. Treasury note is at 3.819%, down -0.58%. Trade docket today: Very light. DLTR, DJT, IWM and getting our SPX and NDX debit 0DTE anchors back in place. Let's take a look at some key levels today. Both the NDX and SPX blew through my support levels from yesterday. /ES; On the daily chart its all bearish. Bearish candle. Below the 50DMA. Selling vol increasing. Stoc and RSI flashing sell signals and MACD looking to confirm today if we get continued weakness. Intra-day on /ES; Resistance levels are pretty clear. 5546 then 5570 to the upside. 5507 is the first support with 5475 below that. Below 5475 we could open up some downside potential. /NQ; price action looks ugly. All indicators are flashing sell. I'd put the target at PoC on the daily chart which is 18,286. This is also just above the 200DMA. Lots of potential downside here. /NQ: intra-day. 19,157/19,351 to the upside. 18,837/18632 to the downside. My bias today: Bearish. Hard not to be. Let's see if we can put up some green today, for a change!
0 Comments
Your comment will be posted after it is approved.
Leave a Reply. |
Archives
November 2025
AuthorScott Stewart likes trading, motocross and spending time with his family. |


