|
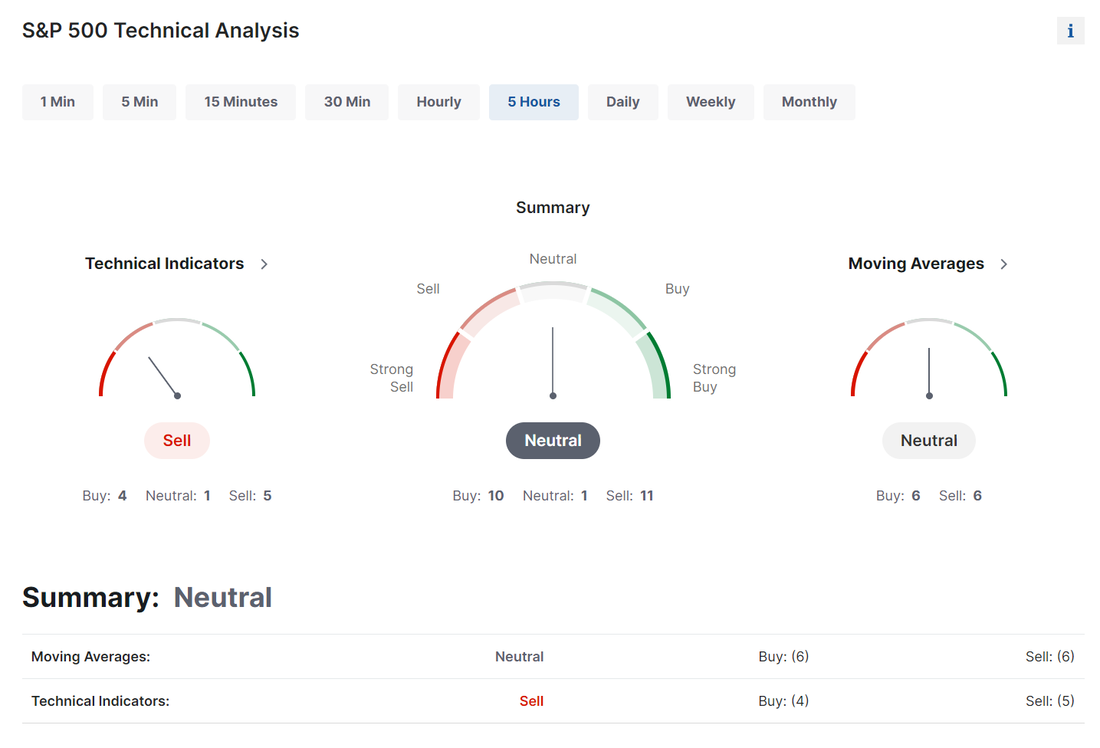
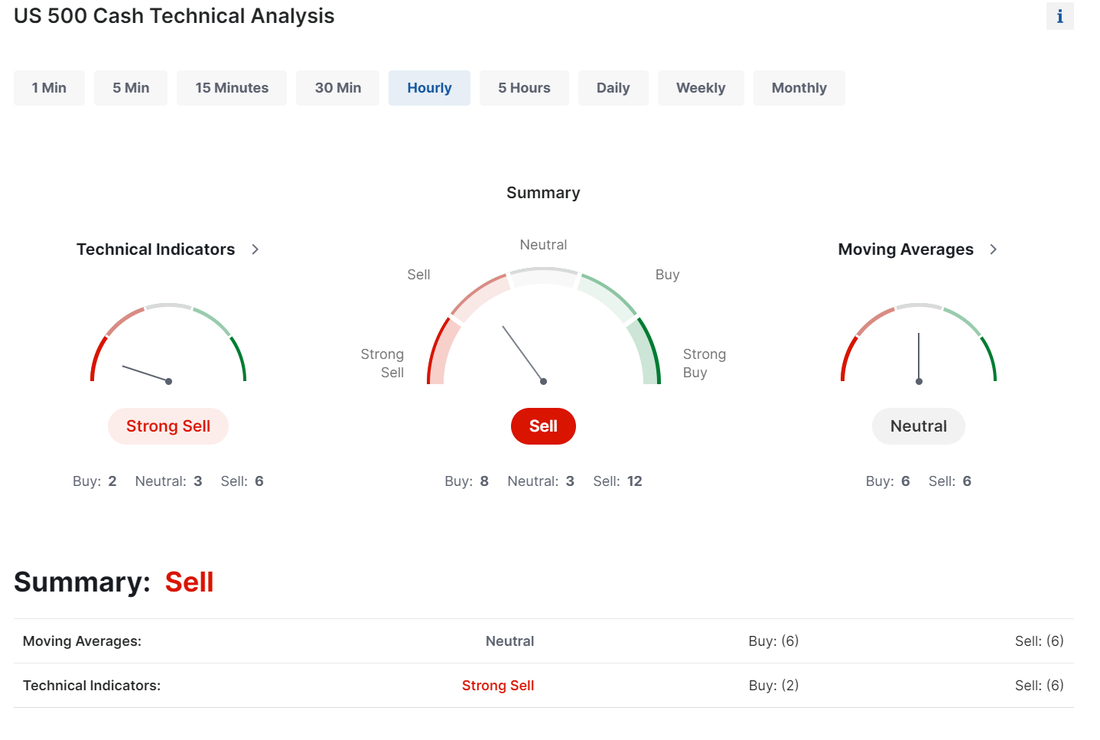
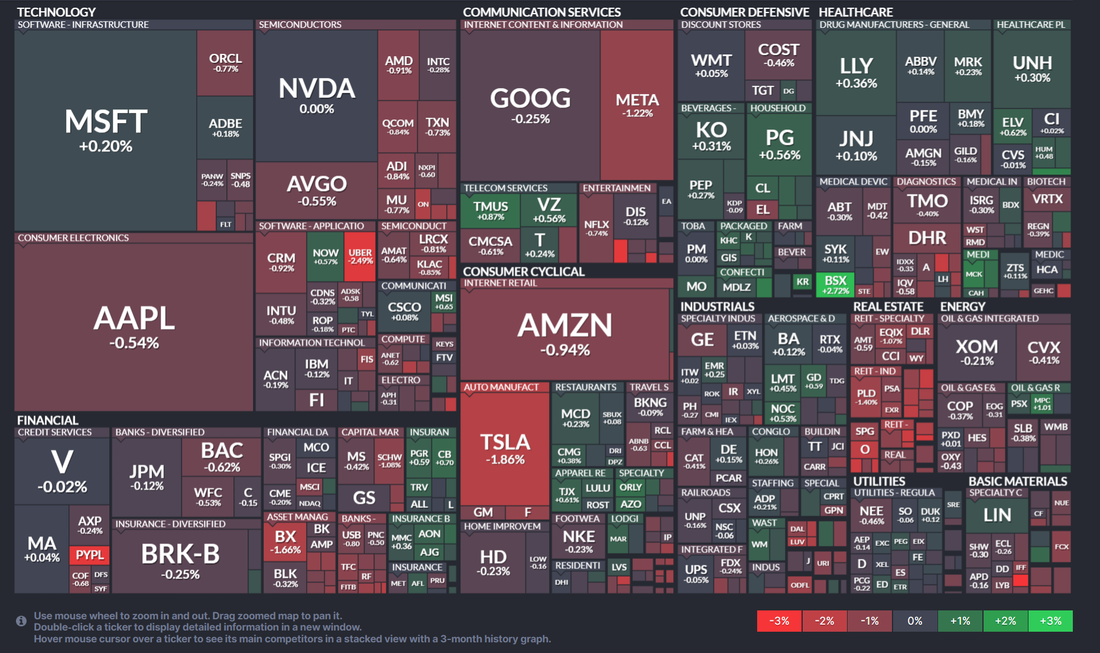
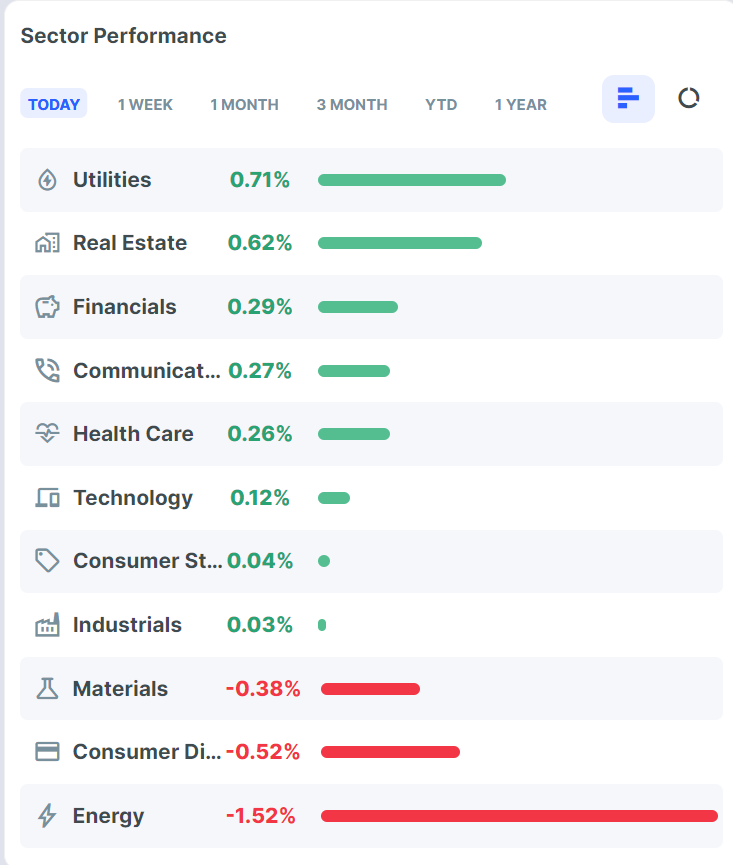
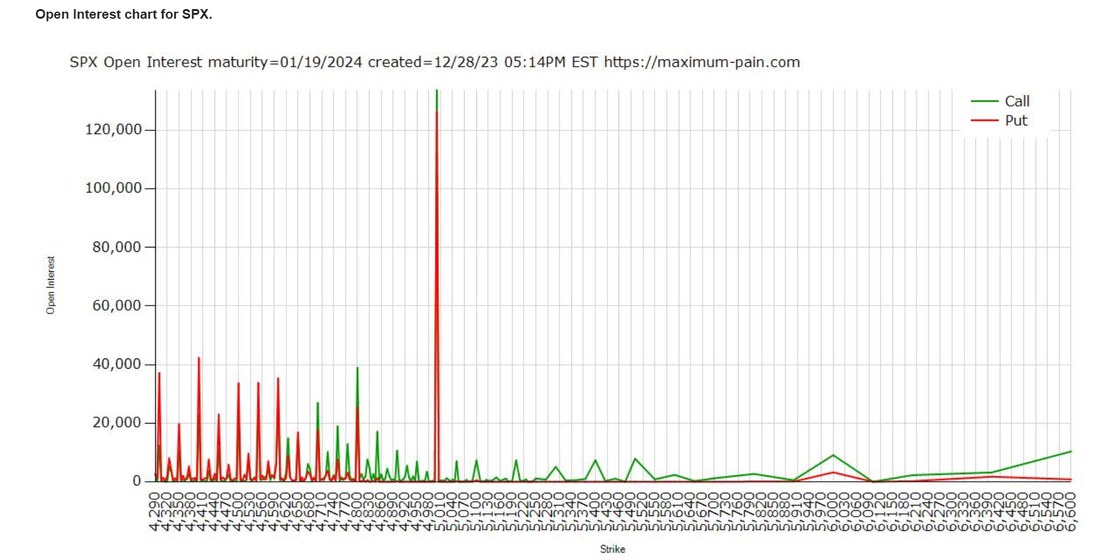
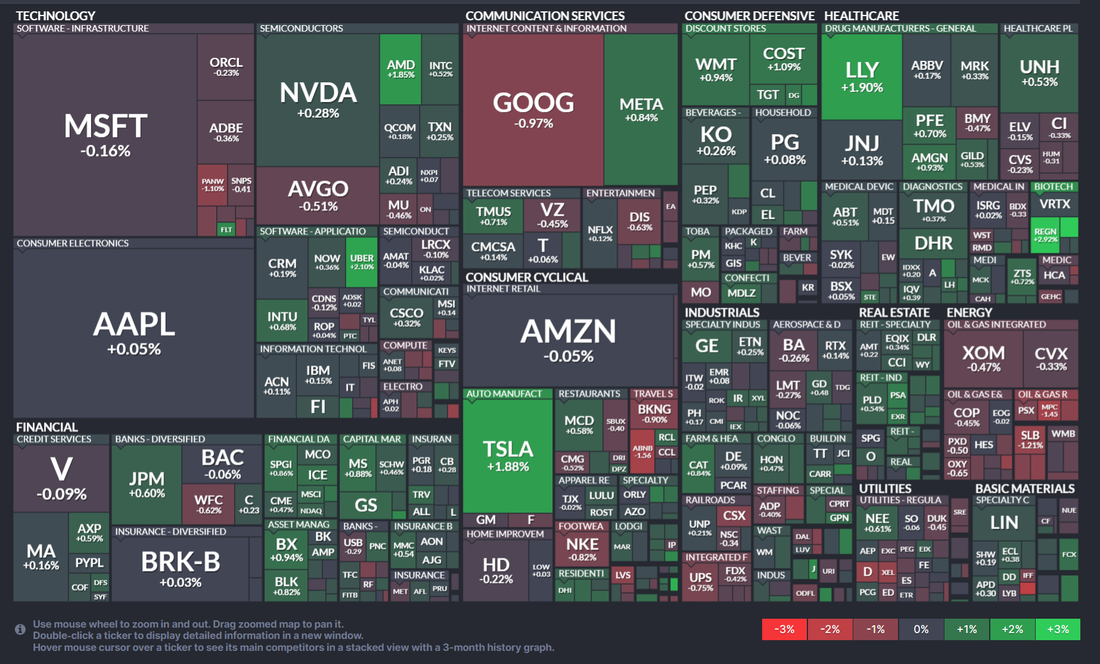
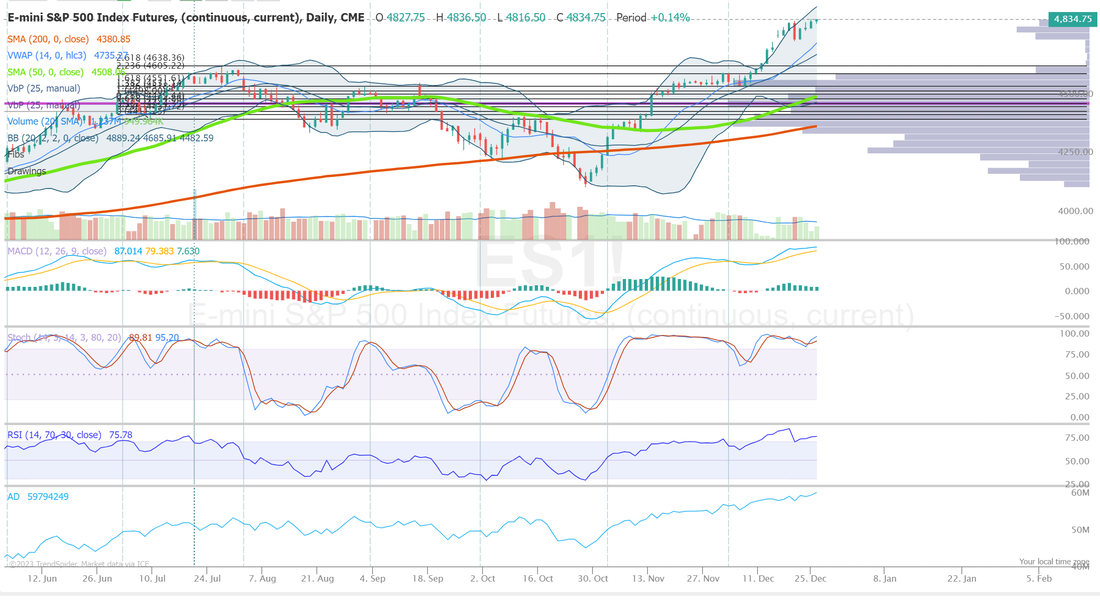
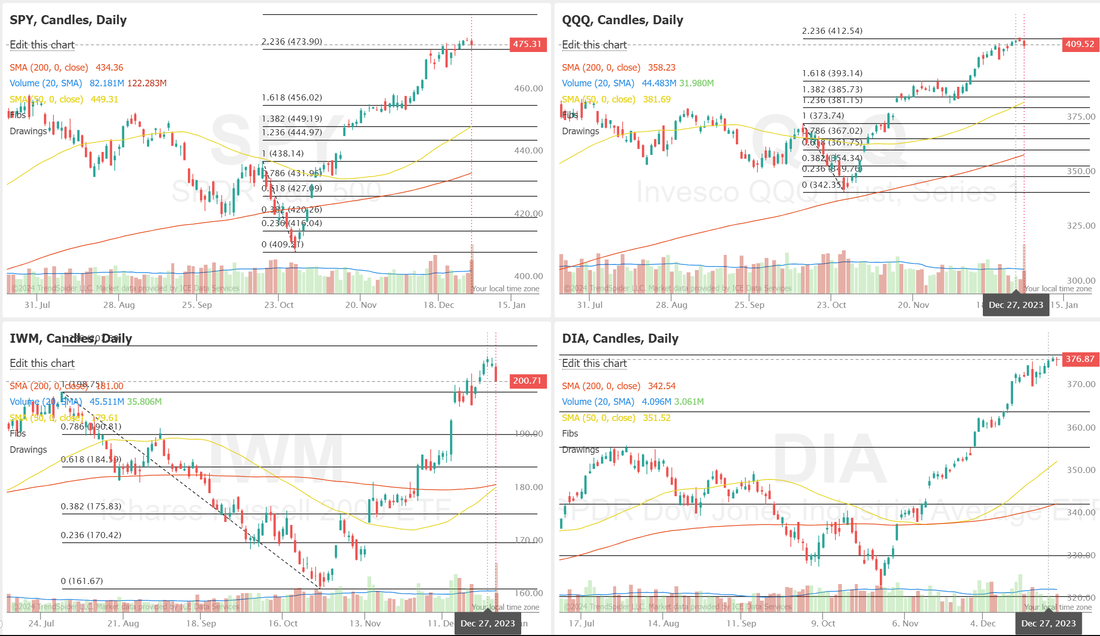
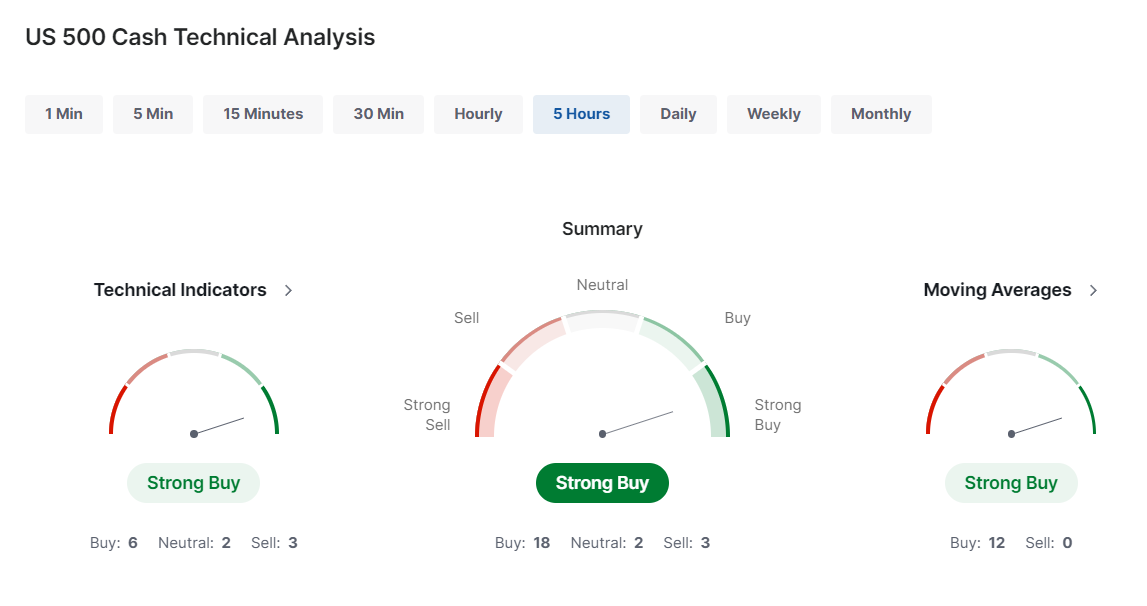
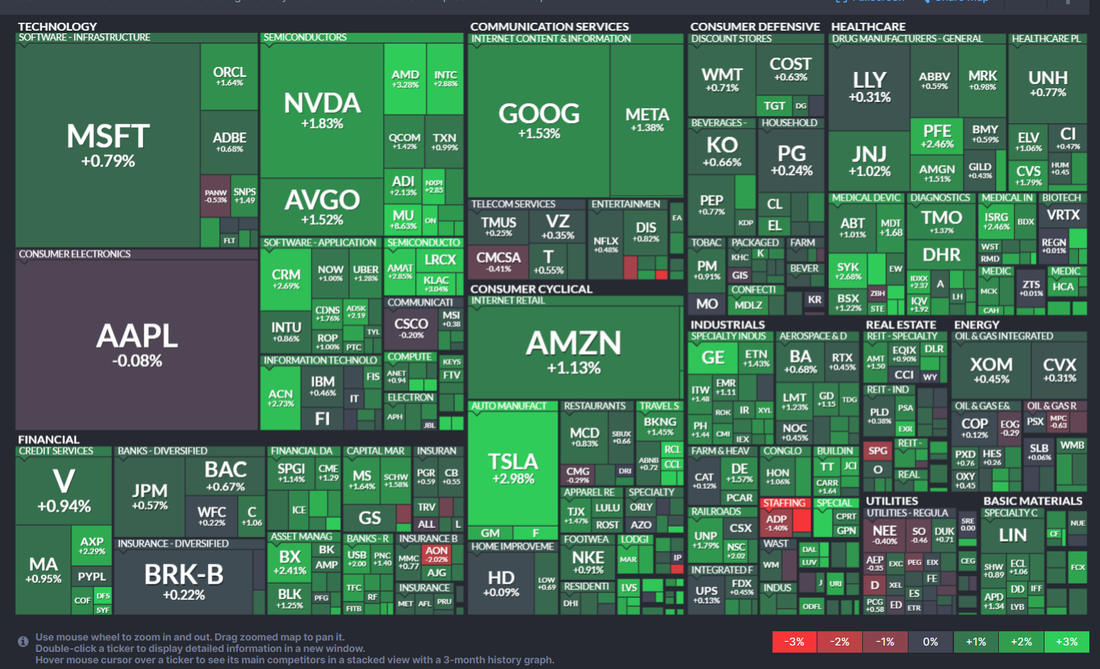
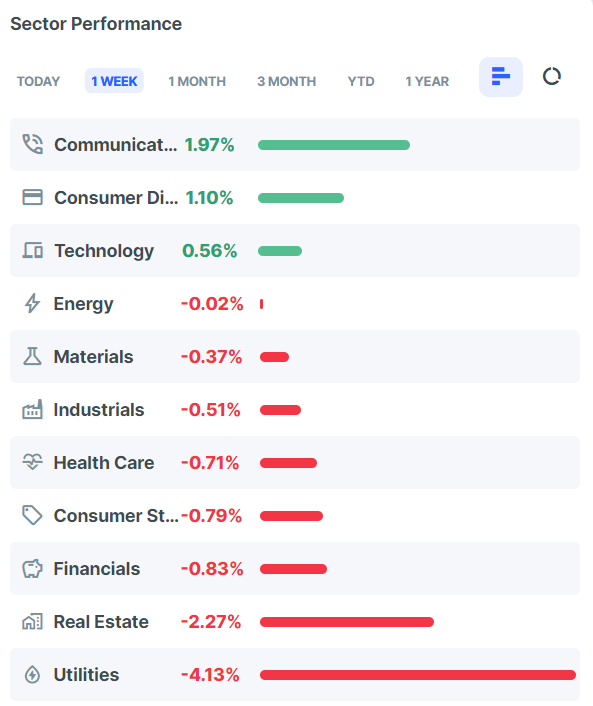
It feels like ground hog again, once again. Same old story. The market is bullish. It seems to be running out of gas. Bears try (almost daily now) to turn the tide with little success. Friday is going to be a light vol day with the three day holiday coming up. Algos that would normally be absorbed by normal order flow can and do create erradic moves. Trade small and pick you best setups for tomorrow or, take an early weekend. We've had a stellar week with yesterday adding $7,000 to my net liq with our NDX 0DTE hitting for another full profit and our long suffering RUT and Bond trades contributed to our gains. As you can see, the normal 5 hr. technicals we pull from every day are still quite nicely flashing bullish but... Taking a look at the hourly shows the bears are trying at the close to change the directional bias. Heat map was not impressive save for the Utilities. That can often be the canary in the coal mine. Tech strength usually leads us up and strong rotation into Utilities can be an indication that "risk on" money is rotating to "safe haven" It's also interesting to see where all the open interest lies. You can see that there is a lot of call selling above us and lots of put buying (cheap insurance) below us. As I stated above; The trend is clear...its up but, the technicals are overstretched to the upside. It wouldn't take much to pull 3% right out of this market Intra day levels for me: 4833/ 4836/ 4841/ 4850 (key level) to the upside. 4826/ 4822/ 4817/ 4811 to the downside.
See you all in the trading room tomorrow. I'm flying out of Paris early through London and then on to Scotland so it will be a long day for me but rest assured, we'll get our trading in!
0 Comments
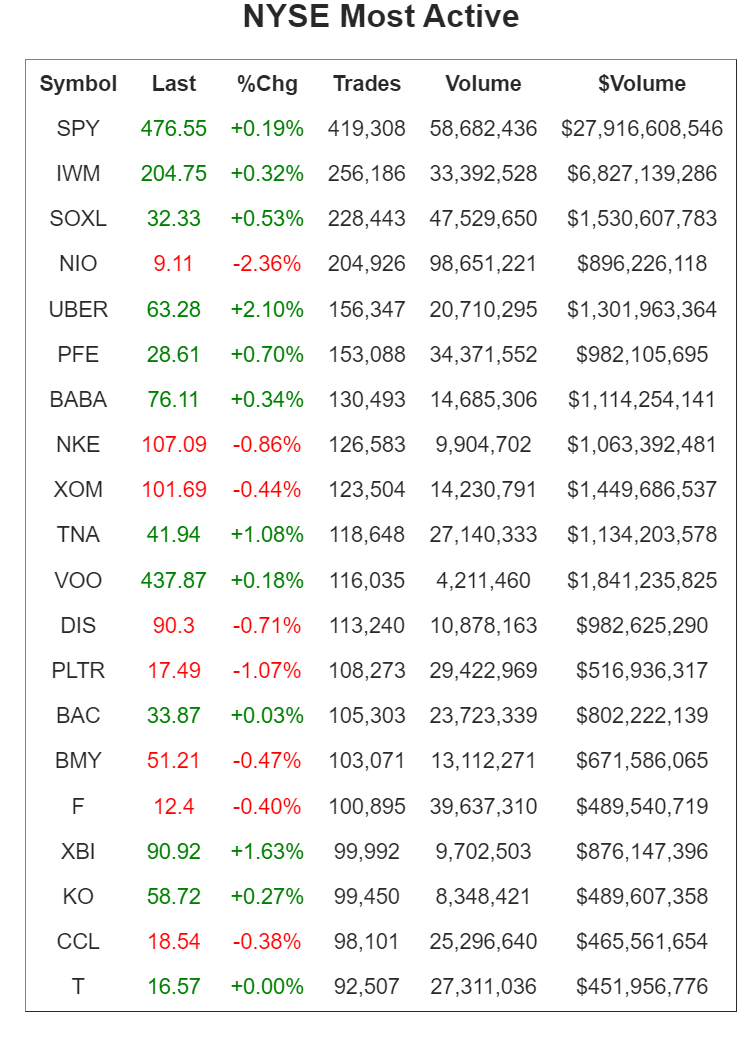
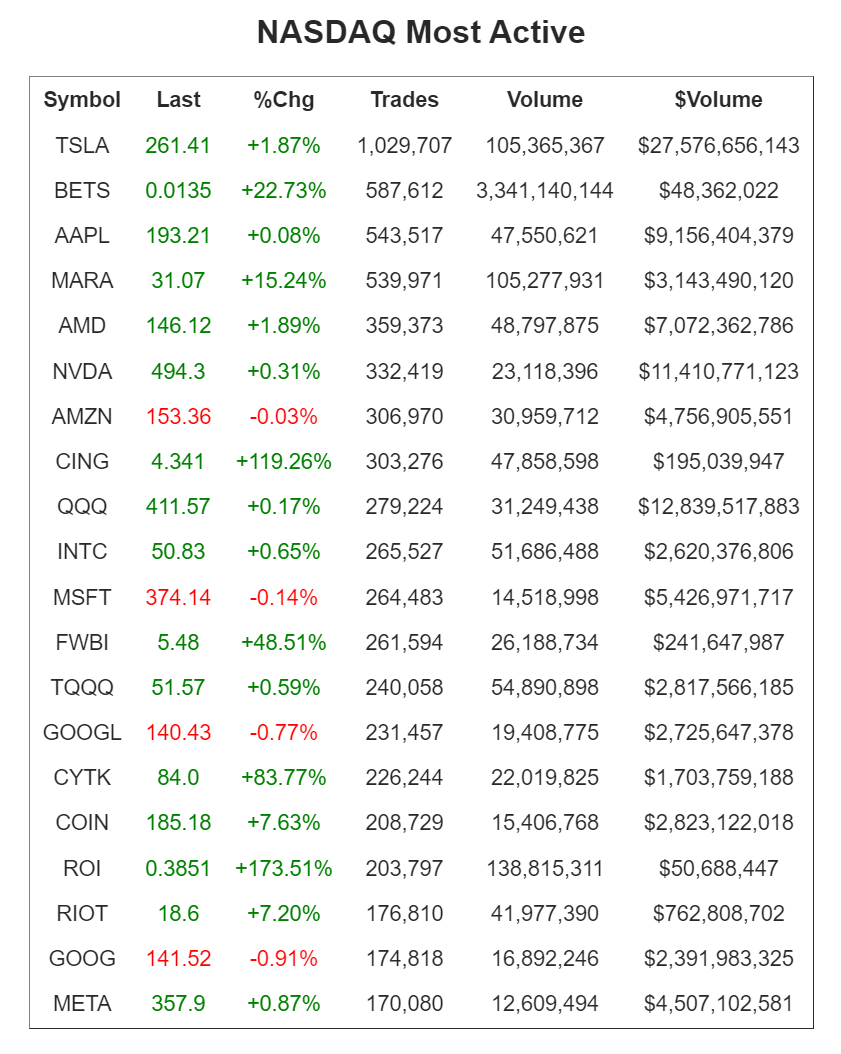
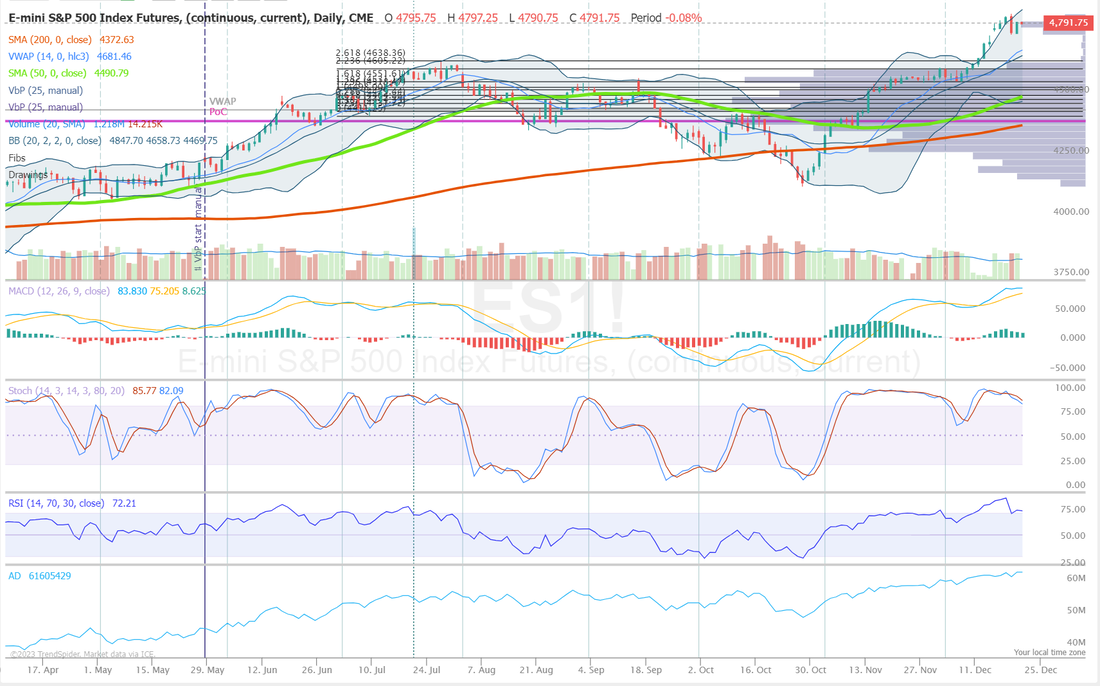
We had another stellar day yesterday with a full profit on our NDX 0DTE at almost 9% ROI and our Nat gas trade, that we planned on rolling, expired fully profitable. We will continue to look to place our trades later in the day, towards the power hour. Technicals continue to give us buy signals. We continue the march to new ATH's on the four major indices we trade with the DIA already there. The heat map from yesterday was somewhat mixed though. The buying is still there. The pressure is still up buy you'll notice we had a very favorable NDX 0DTE setup yesterday from the call side. That hasn't happened in a while. Heat map looks mixed. There was still plenty of activity if you look at the Nasdaq and NYSE active lists All our technicals, no matter which one you choose, are overstretched to the upside, yet the march up continues. You can see how far away and stretched we are from the PoC area (purple line) on the daily chart Intra day levels for me: On the upside, 4850 is my only number for today on /ES. We break that, we break our ATH and we move into new, bullish territory. On the downside: 4822/4875/403/4795.
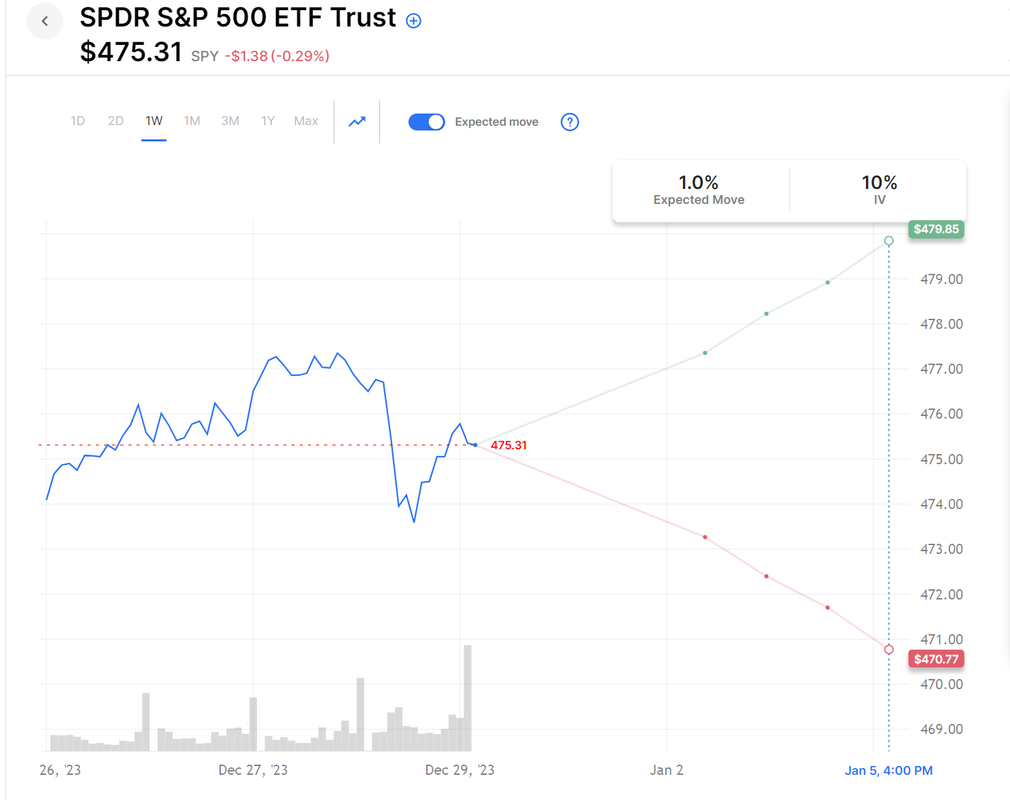
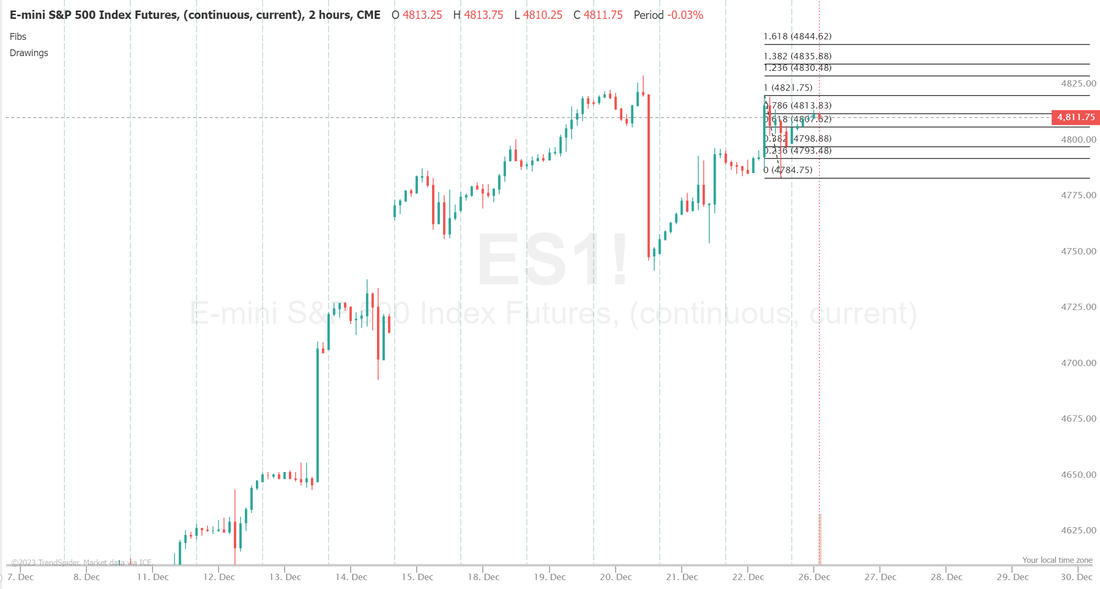
Good Morning! I hope everyone had a wonderful and Merry Christmas. As a full time trader, its nice to get a "day off" every once in a while to recharge the batteries. I'm coming to you this week from the city of lights, Paris. This means I'm working 8 hours ahead of my normal schedule so my trades will be coming later in the day, closer to the power hour. Let's get into our daily analysis. Futures are showing green once again this morining. The heat map from last week continues to show a relatively strong, across the board strength with broad based market participation. The advance/decline line. The up/down volume and the stocks above the 50 and 200 DMA all look healthy. Expected moves for the week are up, ever so slightly considering its a four day trading week but I.V. is still miserably low compared to our heyday of 140 point expected moves. This will most likely mean we will continue to add debit trades into our credit trades. Technicals continue to indicate the same data we've talked about for several weeks now. Yes we are bullish. Yes we continue higher but...it's looking more and more overstretched and while the bears haven't had much success in turning the tide, they keep trying. The 5000 level continues to see ALL the volume. The market is betting heavily that we are topping here. Intra day levels for me today: 4822/4830/4835/4844 to the upside. 4808/4800/4794/4784 to the downside on /ES.
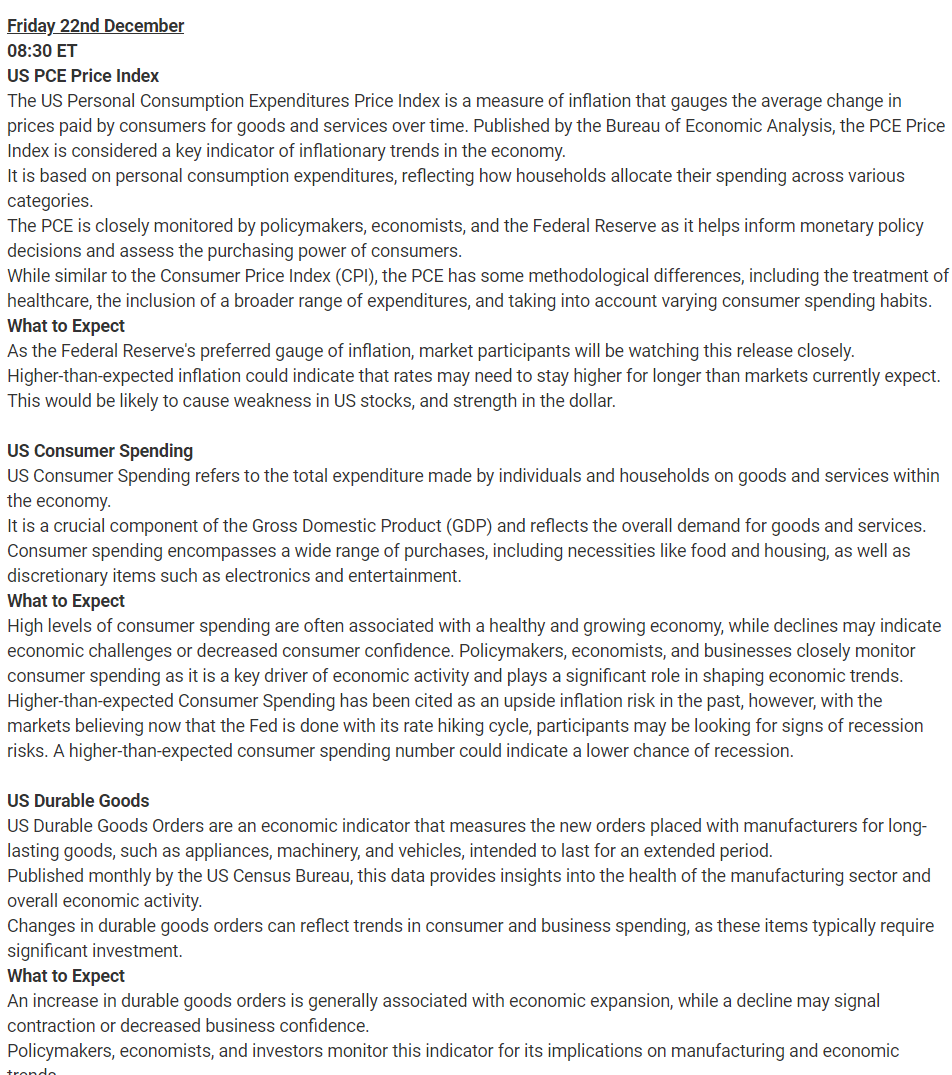
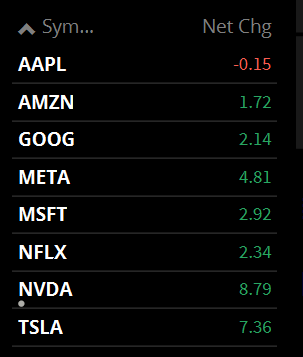
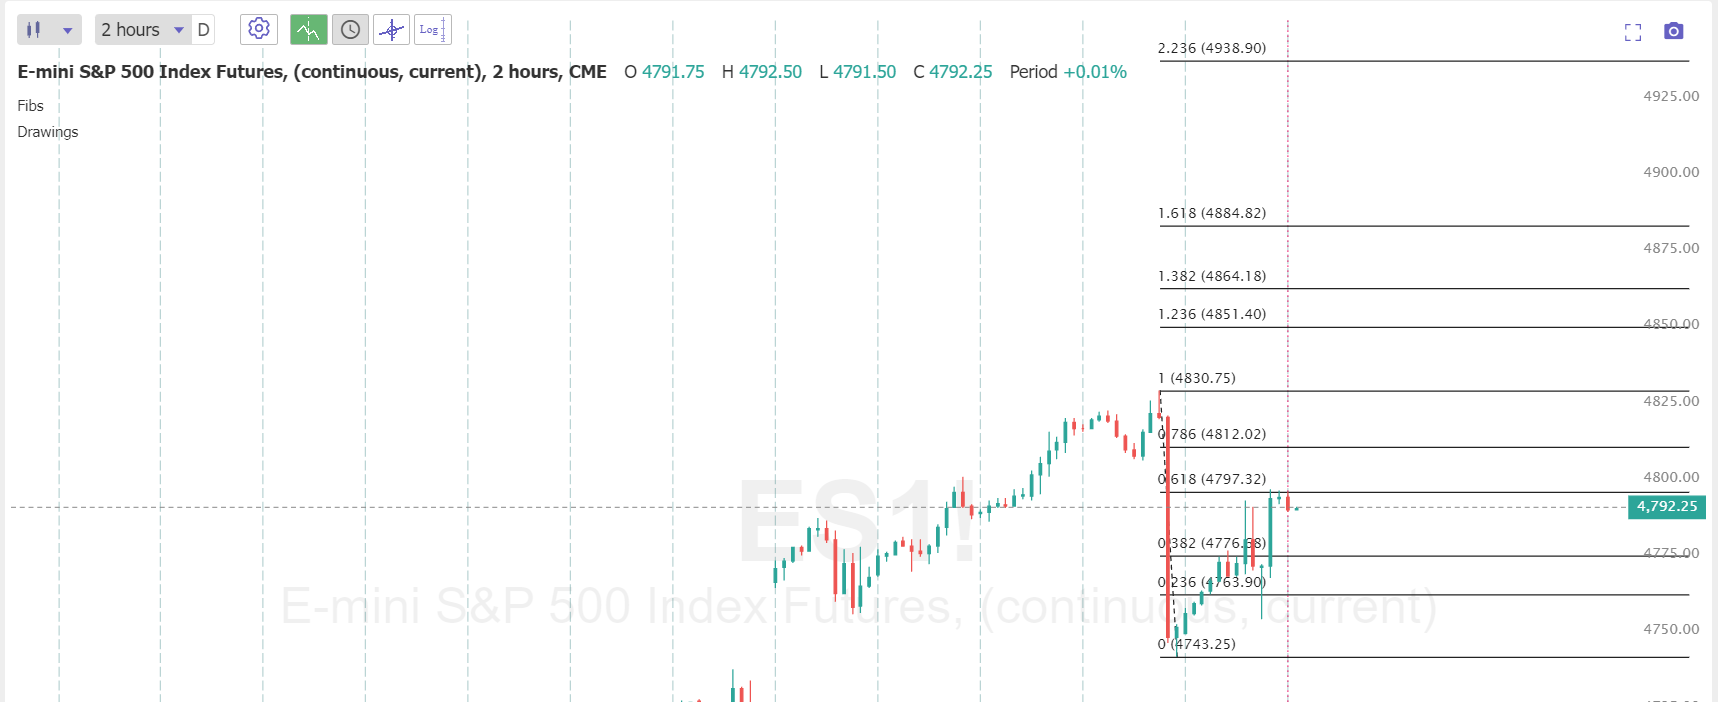
We had a really strong result with our trading yesterday. Both our 0DTE trades scored big wins . Our scalping brought in almost $1,700 dollars with just one trade and our event contract hit for a 35% ROI. The RUT trade continues to pressure us but we have a BF expiring today that looks profitable. We have PCE, Durable goods and Consumer spending out tomorrow morning (chart 1) Technicals are back into buy mode after a one day pause (chart 2). Yesterdays snapback was broad based (chart 3) with all the big tech names participating, sans AAPL (chart 4). Utilities continue to get beat up in this rotation back to tech (chart 5). My analysis continues to be the same. We are bullish. The bulls appear to be running out of steam. We are overstretched to the upside. It looks like we want to roll over. It ain't happening. Every time the bears look like they have a grasp on the controls the bulls come roaring back. (Chart 6) RSI is very overstretched here. Intra day levels for me today: Two key levels (Chart 7) 4831 to the upside (yesterdays high) and 4743 to the downside. (yesterdays low). Between these two levels is just a lot of chop with light, pre-holiday action. That being said, to the upside: 4811/4829/4850/4864. To the downside: 4776/4763/4742/4718 (Chart 8)
|
Archives
December 2025
AuthorScott Stewart likes trading, motocross and spending time with his family. |
