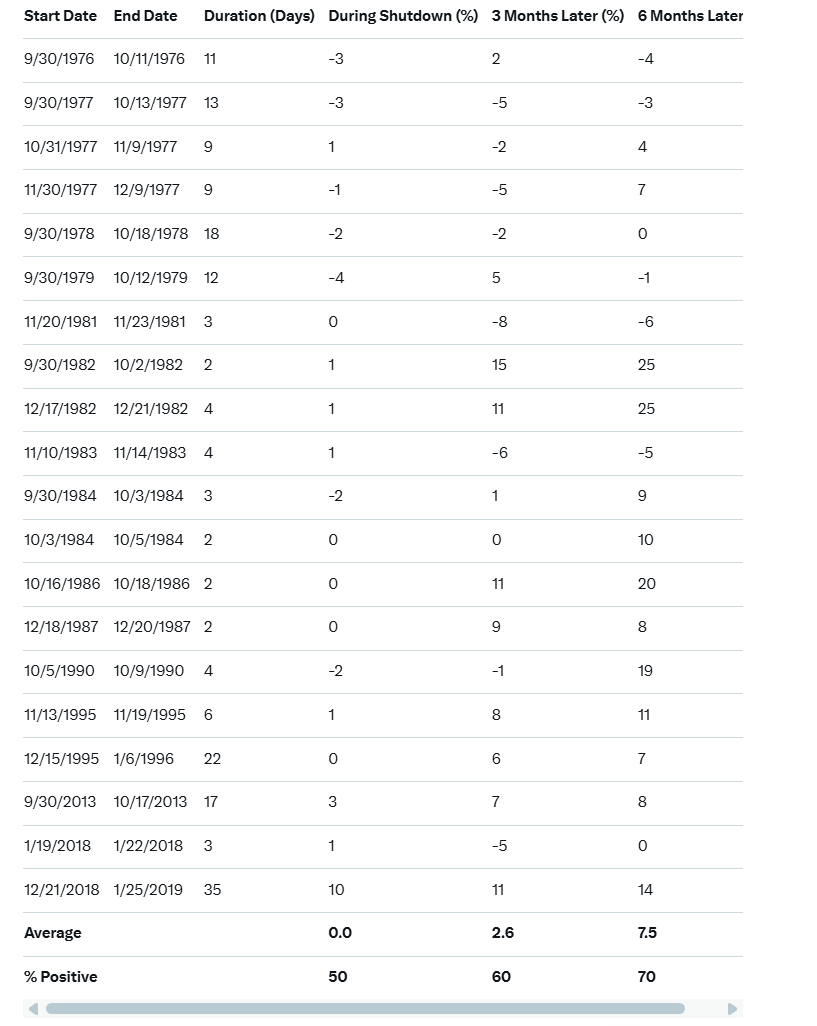
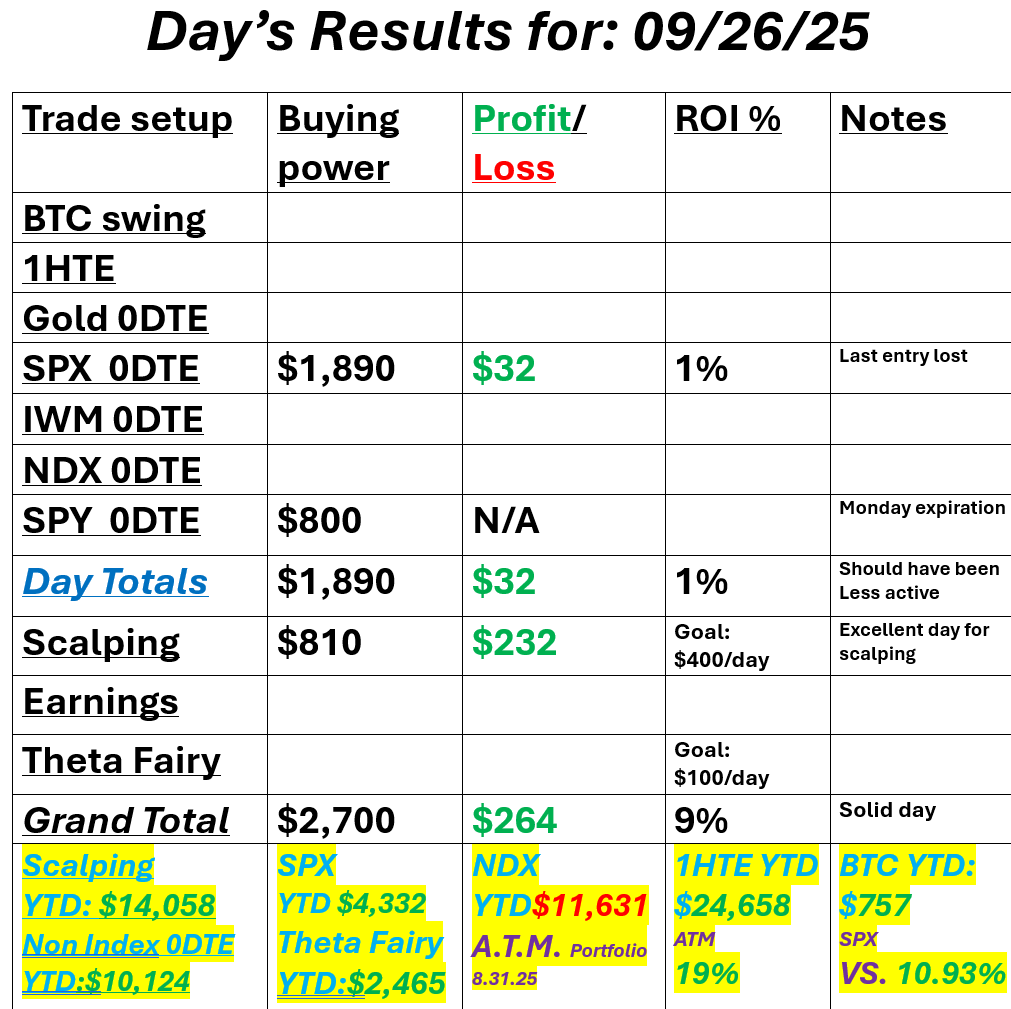
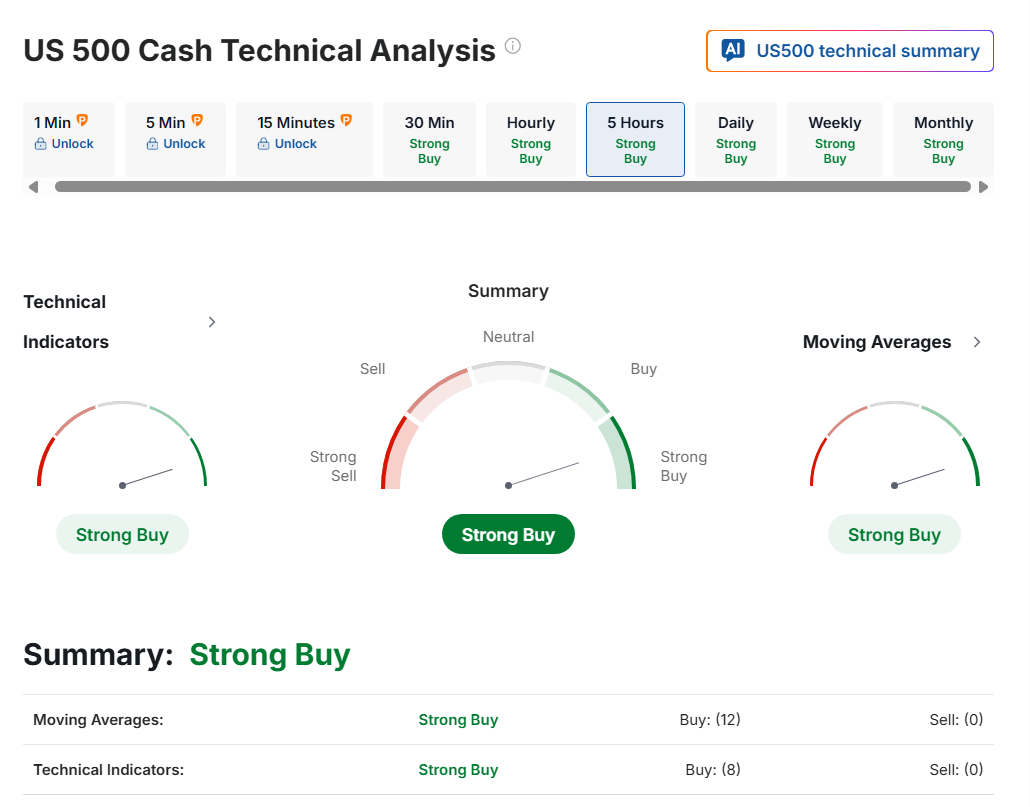
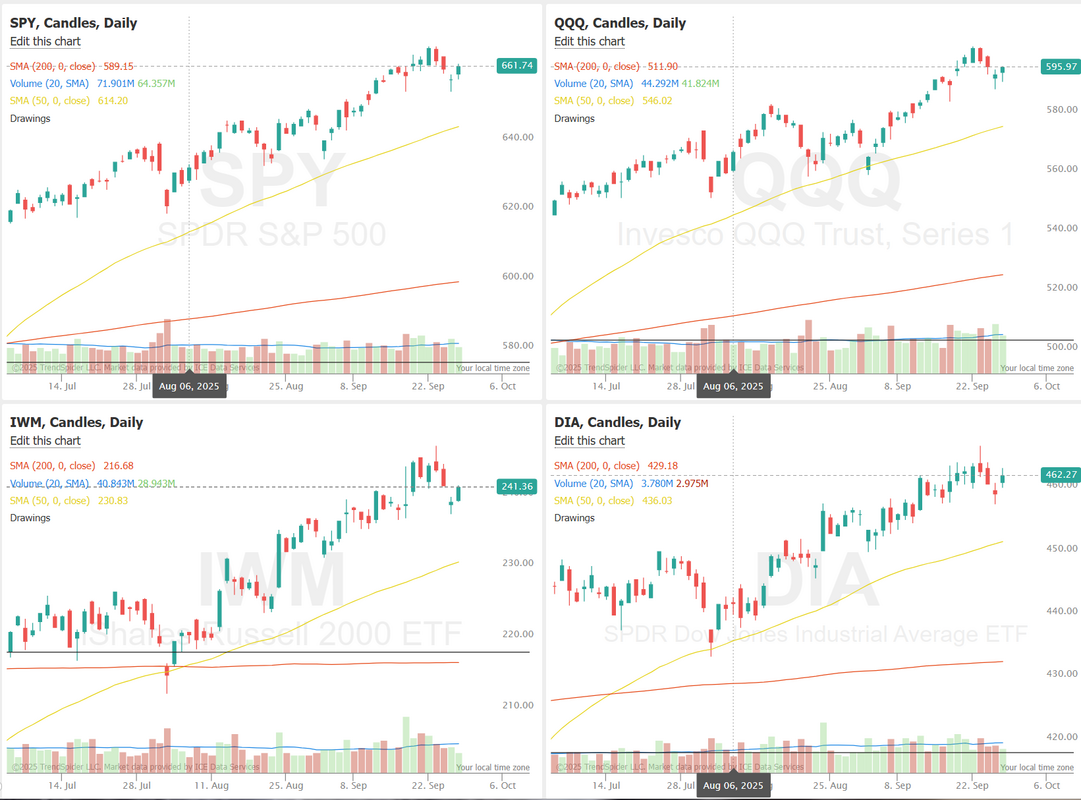
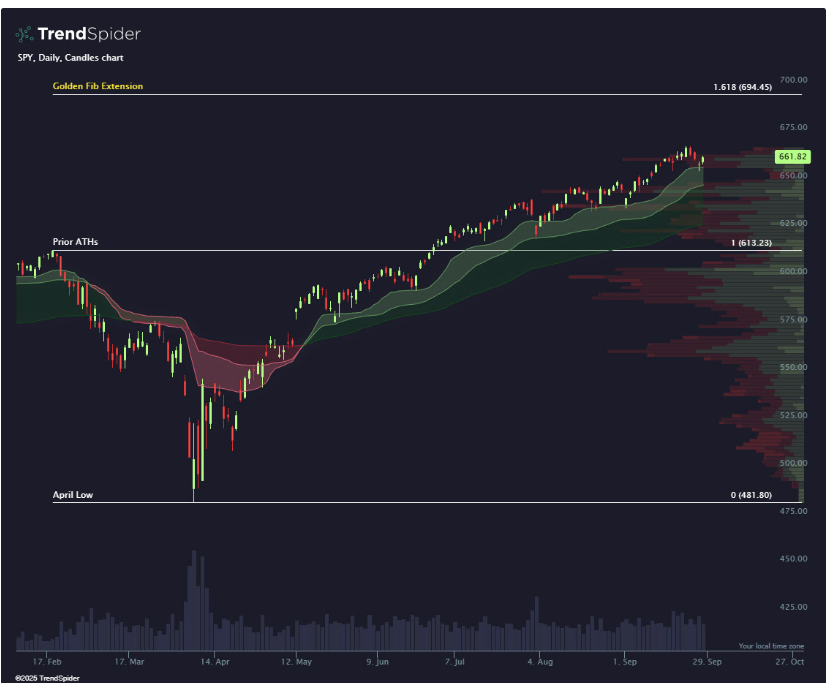
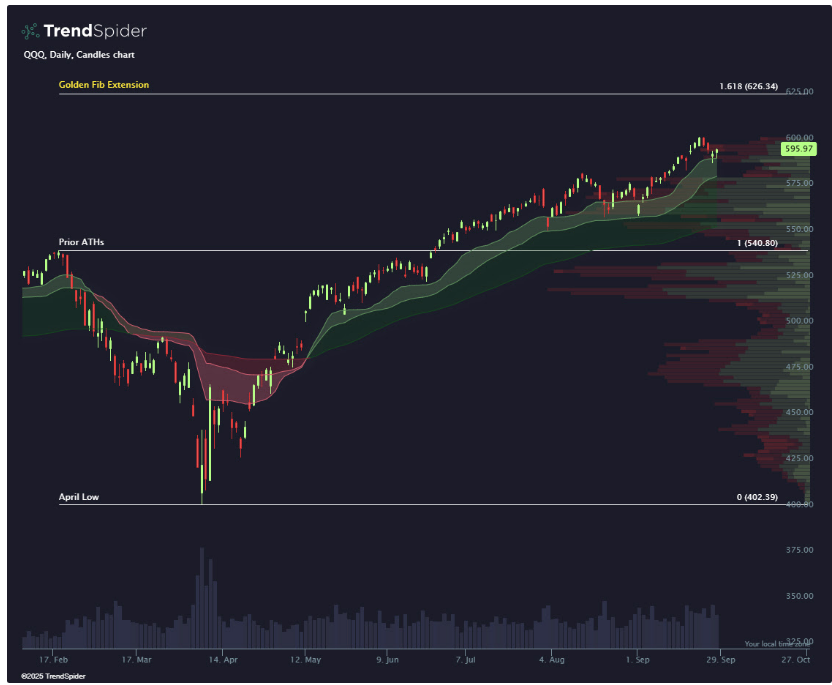
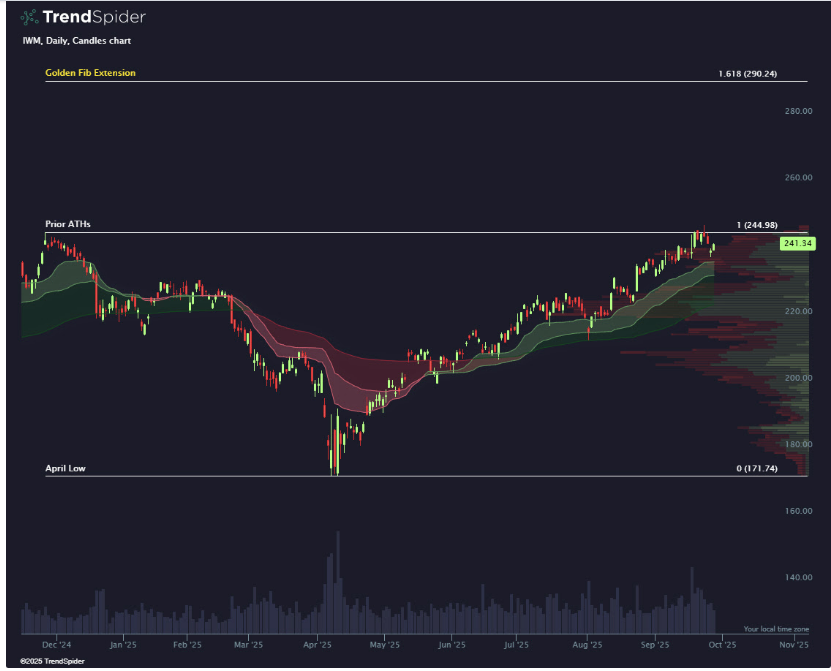
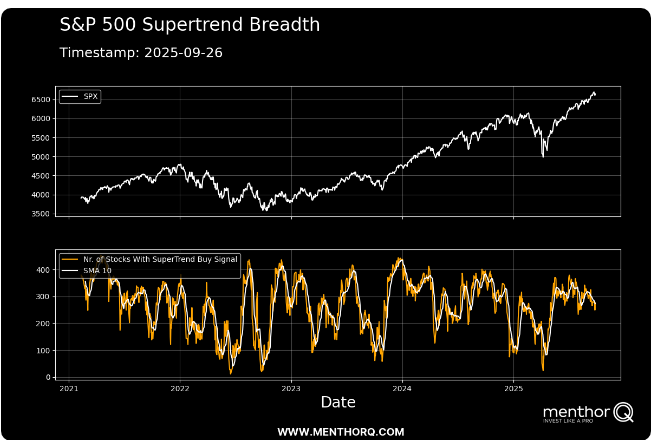
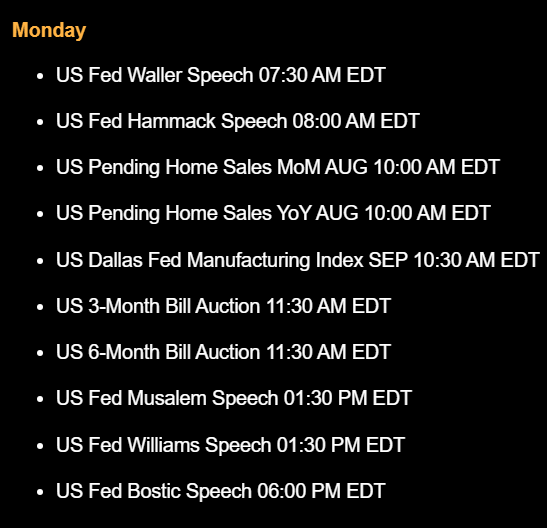
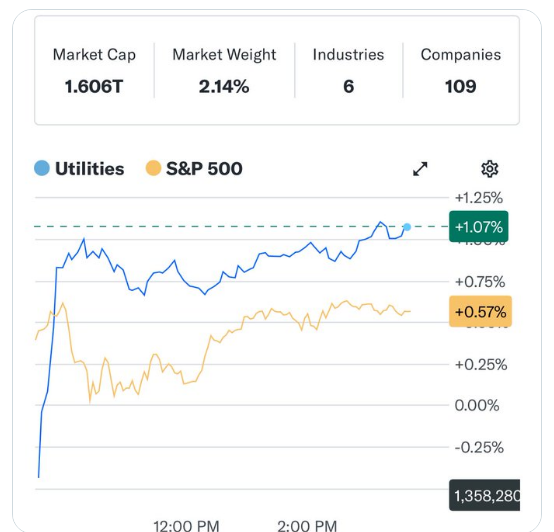
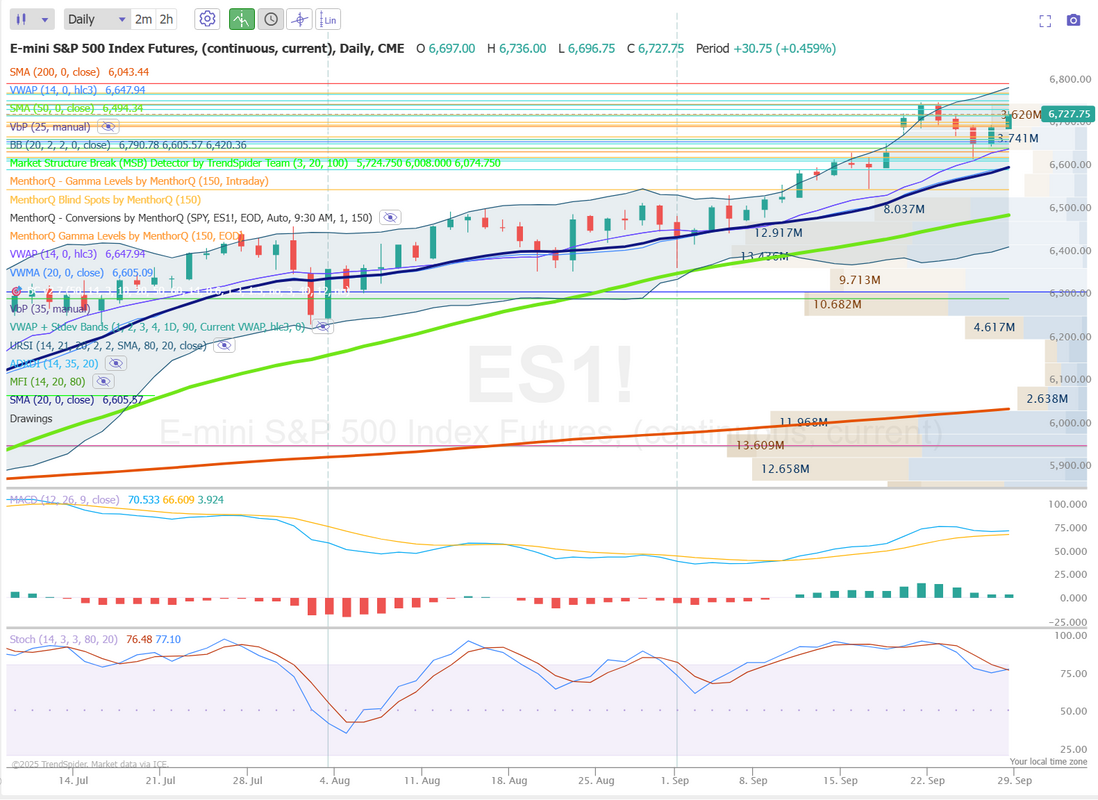
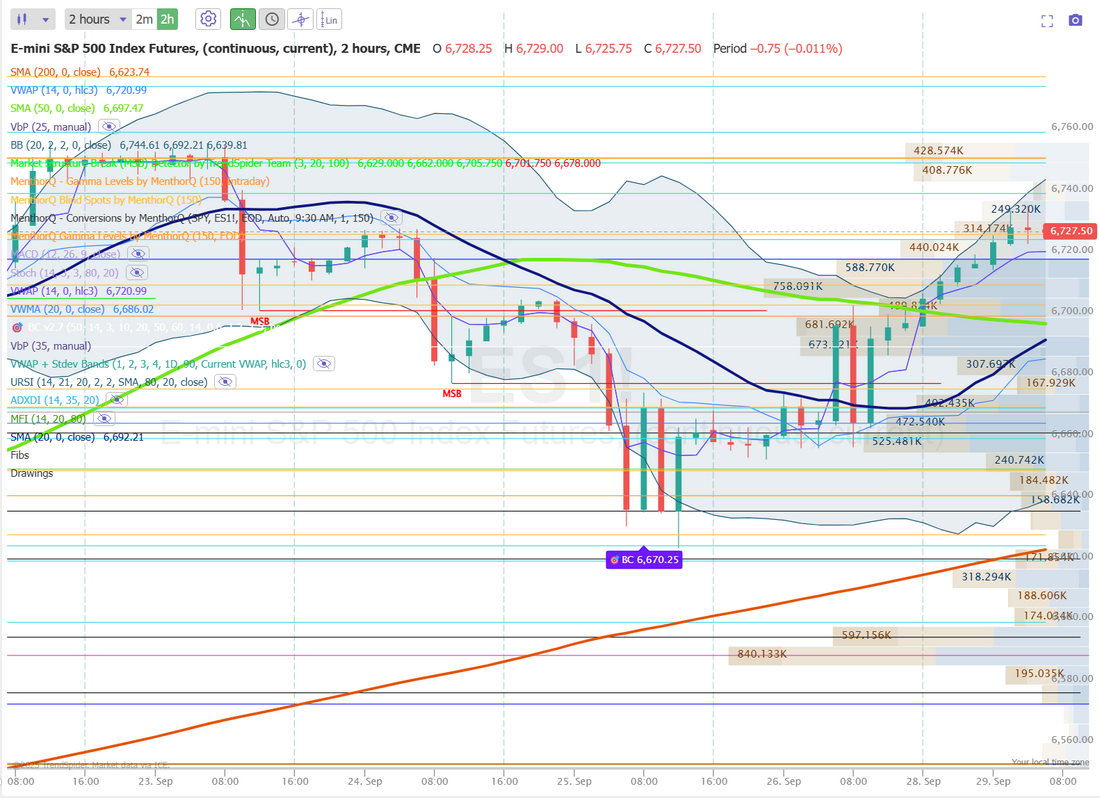
Shut downs. Rebounds. Tesla salesThese are just a few of the news items we are watching this week. After three decisive down days and a losing week last week for the markets, they are looking to rebound. Can the bulls take back over? We aren't far from our ATH's. Futures are up strongly this morning. We also have Tesla car sales results Weds. The stock has really stretched itself in the last two weeks. The numbers should be bad. How the market interprets that, though? That's anyone's guess. Musk has done a good job of moving focus away from autos to Robo taxis, Robots and A.I. We've also got a government shutdown looming. We've gotten used to the last-minute brinkmanship that comes with these events, only for them to be solved at the last moment. This time may be different. Both sides of the aisle seem willing to let this happen. What will that do to the markets? Here's a look at how that has historically played out. Historically, the U.S. stock market, as measured by the S&P 500, has shown remarkable resilience to federal government shutdowns, with performance during these events averaging near zero percent and often turning positive in the months following resolution. Since 1976, there have been 20 shutdowns lasting at least one day, with an average duration of about 8 days. The median return during these periods has been effectively flat (0%), though outcomes vary by event—ranging from declines of around 4% in some cases to gains exceeding 10% in others. Longer shutdowns (e.g., 10+ days) have occasionally coincided with slightly more negative median returns of about -2%, but post-shutdown rebounds are common, with average gains of 2.6% three months later and 7.5% six months later across all events.To illustrate, here's a table summarizing S&P 500 total returns for all 20 shutdowns since 1976, based on data through early 2019 (the most recent major event): Shorter shutdowns (1-3 days, which account for over half of all events) tend to have negligible impact, while the longest—the 35-day 2018-2019 shutdown—saw the S&P 500 rise 10.3% amid broader market momentum. Economic effects are typically temporary, trimming GDP growth by 0.1-0.2% per week of closure, but markets often "look through" the noise, prioritizing fundamentals like earnings and interest rates over political gridlock.A slightly different dataset focusing on 10 notable shutdowns since 1981 (excluding very brief ones) shows an average during-return of 1.5% and a median of 0.5%, with 12-month post-shutdown gains averaging 19.1%. Notable outliers include the 1995-1996 events (totaling 27 days across two), where markets were flat during but gained 18-23% over the following year.In the current environment as of September 2025, with a potential shutdown looming over funding disputes, historical patterns suggest limited lasting damage—though some analysts note the weaker economic backdrop could amplify short-term volatility compared to past cycles. Overall, shutdowns have rarely derailed bull markets and have even coincided with gains in resilient periods. We had an O.K. day on Friday. My last SPX entry lost but over all we were profitable again on the day. Here's a look at the day. Let's take a look at the markets to start this new week. Technicals are back to bullish! Bulls came fighting back on Friday. Futures are up this morning. SPY ended the week mostly unchanged at $661.82 (-0.27%), continuing to hold above key support. Price has bounced several times off the Short line of the Dynamo Cloud Indicator, a trend-following tool that combines volatility-adjusted moving averages with momentum to visualize trend direction and strength. If SPY remains above the green cloud, bulls may be eyeing the next major target near the 1.618 Fibonacci extension. QQQ fell slightly to $595.97 (-0.56%), holding up well even as inflation-sensitive assets like gold and silver posted strong gains. The ETF has repeatedly found support at the Long line of the Dynamo Cloud Indicator, signaling that bullish momentum remains intact. With tech holding firm amid shifting macro currents, traders are left wondering whether inflation risk is already priced in or if pressure is quietly building under the surface. IWM was the weakest of the major indexes this week, closing at $241.34 (-0.66%). Despite leading the decline, the small-cap ETF didn’t even retest the Short line of the Dynamo Cloud, underscoring the strength of its recent uptrend. The trend remains bullish, but reclaiming resistance near the recent all-time highs will be critical for small-cap bulls to maintain momentum. The SPX supertrend breadth chart shows that the index remains near recent highs, while the number of stocks generating buy signals has been trending lower. This indicates that fewer individual stocks are participating in the rally compared to earlier periods. The divergence between index levels and breadth readings highlights current market dynamics: the index continues to perform strongly overall, but the underlying participation appears narrower. December S&P 500 E-Mini futures (ESZ25) are up +0.48%, and December Nasdaq 100 E-Mini futures (NQZ25) are up +0.63% this morning, pointing to a higher open on Wall Street as Treasury yields moved lower, while investors await U.S. President Donald Trump’s high-stakes meeting with congressional leaders to prevent a government shutdown. Top congressional leaders will meet with President Trump at the White House one day before federal funding lapses if the two parties fail to agree on a short-term spending bill. Republicans aim to pass a seven-week stopgap spending bill before negotiating any deals, while Democrats are demanding billions in healthcare funding before agreeing to a GOP plan. Raising the stakes, White House budget director Russ Vought directed agencies to prepare lists of employees to fire if funding lapses, going beyond the temporary furloughs and missed paychecks seen in past shutdowns. This week, investors also look ahead to remarks from Federal Reserve officials as well as a slew of U.S. economic data, with a particular focus on Friday’s nonfarm payrolls report. However, in the event of a federal government shutdown, the jobs report will be postponed if the Department of Labor follows an operational contingency plan outlined earlier this year. In Friday’s trading session, Wall Street’s major equity averages ended in the green. Electronic Arts (EA) surged over +14% and was the top percentage gainer on the S&P 500 and Nasdaq 100 after The Wall Street Journal reported that the company was in advanced talks to go private in a roughly $50 billion deal. Also, chip stocks rallied after The Wall Street Journal reported that the Trump administration was considering a policy requiring U.S. firms to manufacture domestically as many chips as they import, with GlobalFoundries (GFS) climbing more than +8% and Intel (INTC) rising over +4%. In addition, Paccar (PCAR) advanced more than +5% after President Trump announced a 25% tariff on imports of heavy trucks. On the bearish side, Costco Wholesale (COST) fell over -2% and was the top percentage loser on the S&P 500 and Nasdaq 100 after the bulk retailer reported weaker-than-expected FQ4 U.S. comparable sales growth. Data from the U.S. Department of Commerce released on Friday showed that the core PCE price index, a key inflation gauge monitored by the Fed, rose +0.2% m/m and +2.9% y/y in August, in line with expectations. Also, U.S. August personal spending climbed +0.6% m/m, stronger than expectations of +0.5% m/m, and personal income rose +0.4% m/m, stronger than expectations of +0.3% m/m. “Despite another month of elevated inflation, [Friday’s] PCE report was in-line across the board. That gives investors some relief that the current status quo will remain intact, and that the Fed will remain on track to cut rates two more times this year,” said Bret Kenwell at eToro. Richmond Fed President Tom Barkin said on Friday that although both unemployment and inflation have diverged from the targets, he sees only limited risk of further deterioration. At the same time, Fed Vice Chair for Supervision Michelle Bowman reaffirmed her stance that officials should act “decisively and proactively to address decreasing labor market dynamism and emerging signs of fragility.” Cleveland Fed President Beth Hammack told CNBC’s Squawk Box Europe on Monday that the U.S. central bank must keep a restrictive monetary policy stance to bring inflation down to its 2% target. “It’s a challenging time for monetary policy. We are being challenged on both sides of our mandate,” Hammack said. U.S. rate futures have priced in an 89.3% chance of a 25 basis point rate cut and a 10.7% chance of no rate change at the conclusion of the Fed’s October meeting. The U.S. September Nonfarm Payrolls report will be the main highlight this week. Recent soft labor market data prompted the Fed to lower interest rates at its latest meeting, and many expect additional rate cuts in the coming months. HSBC analysts anticipate another “soft” nonfarm payrolls report, which they say would effectively “rubber stamp” a rate cut in October. Analysts also noted that any revisions to prior data will be scrutinized following significant downward revisions in recent months. Ahead of the key jobs report, additional insights into the health of the U.S. labor market will come from the JOLTs Job Openings, ADP Nonfarm Employment Change, and Initial Jobless Claims. Other noteworthy data releases include the U.S. Conference Board’s Consumer Confidence Index, the Chicago PMI, the S&P/CS HPI Composite - 20 n.s.a., the S&P Global Manufacturing PMI, the ISM Manufacturing PMI, Construction Spending, Factory Orders, Average Hourly Earnings, the S&P Global Services PMI, the ISM Non-Manufacturing PMI, and the Unemployment Rate. Market participants will also parse comments from a slew of Fed officials. Fed Vice Chair Philip Jefferson, Fed Governor Christopher Waller, Cleveland Fed President Beth Hammack, New York Fed President John Williams, St. Louis Fed President Alberto Musalem, Atlanta Fed President Raphael Bostic, Boston Fed President Susan Collins, Chicago Fed President Austan Goolsbee, and Dallas Fed President Lorie Logan are scheduled to speak this week. In addition, several notable companies, including shoemaker Nike (NKE), cruise ship operator Carnival (CCL), payroll processing firm Paychex (PAYX), and snack maker ConAgra Brands (CAG), are slated to release their quarterly results this week. Today, investors will focus on U.S. Pending Home Sales data, which is set to be released in a couple of hours. Economists expect the August figure to rise +0.2% m/m following a -0.4% m/m drop in July. In the bond market, the yield on the benchmark 10-year U.S. Treasury note is at 4.143%, down -1.05%. Friday was a strong save for the bulls but... volume was down 35% and Utilities had most of the strength. Not a great look if you're bullish. My lean or bias today is bullish. It looks like the bulls have found a support area they'd like to protect. Futures are up this morning. We have some FED talk but not much else that should stand in the bulls way. We've got our weekly training session scheduled for today at 12:00 pm MDT. Today's focus will be on building consistency in your results. Please join us on the live zoom feed to participate! Let's take a look at our intra-day levels on /ES: The daily chart doesn't tell us much. Price action is bullish but MACD and Stoch are neutral to slightly overstretched. Looking at the 2hr. chart. 6741 is first resistance zone. 6752 in next and key. This is were we were "stuck" in the market when the down turn started. A break above this would be very bullish. 6760 is the next level above that. 6725, 6719, 6710, 6699 are the support zones. It's always a pleasure to be back with you all trading a new week. I'll see you in the live trading room shortly!
0 Comments
Your comment will be posted after it is approved.
Leave a Reply. |
Archives
September 2025
AuthorScott Stewart likes trading, motocross and spending time with his family. |
