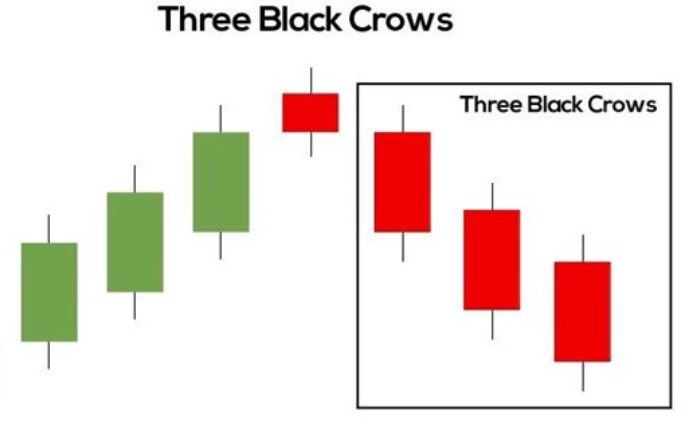
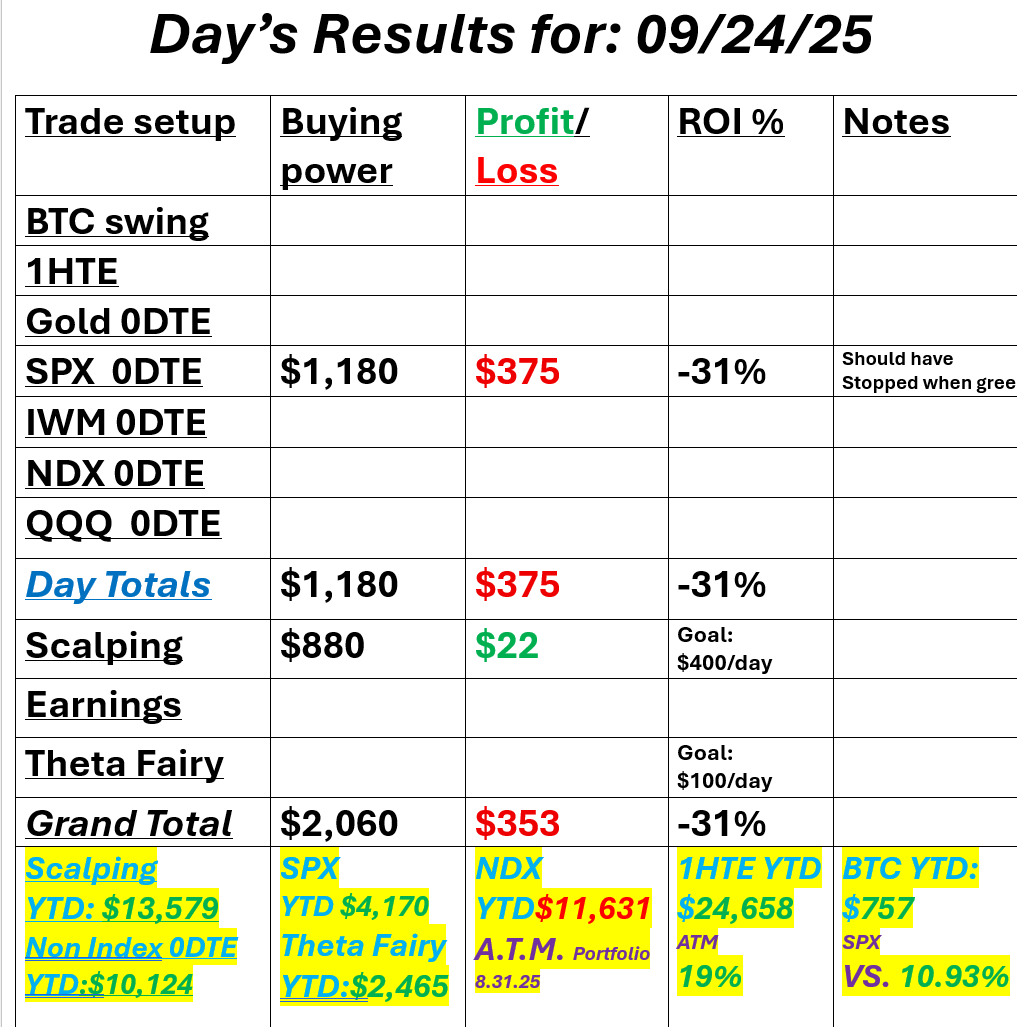
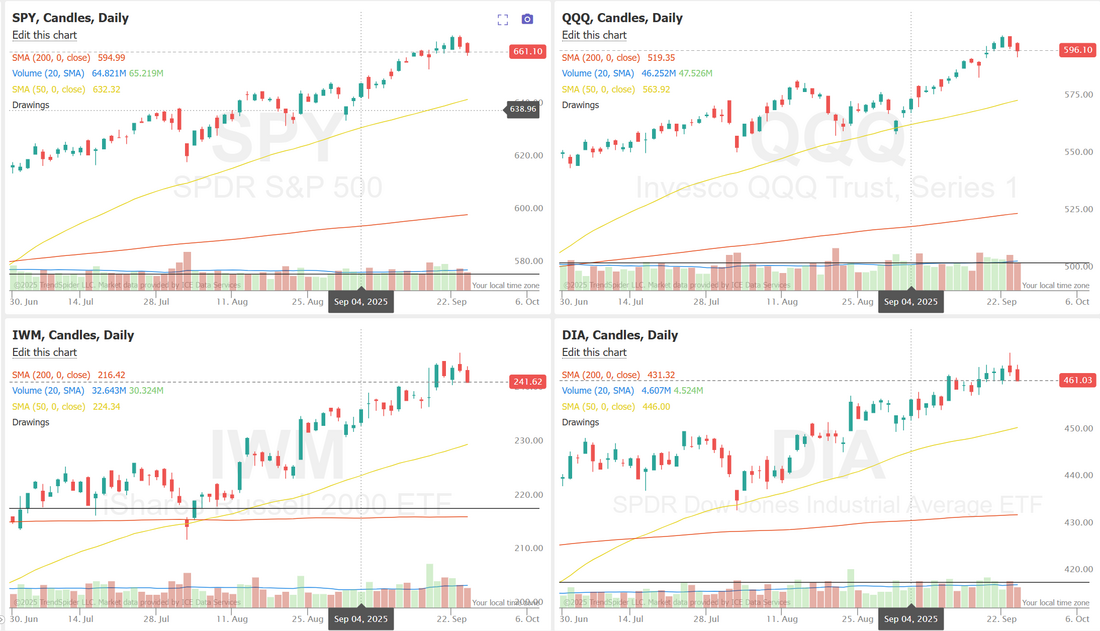
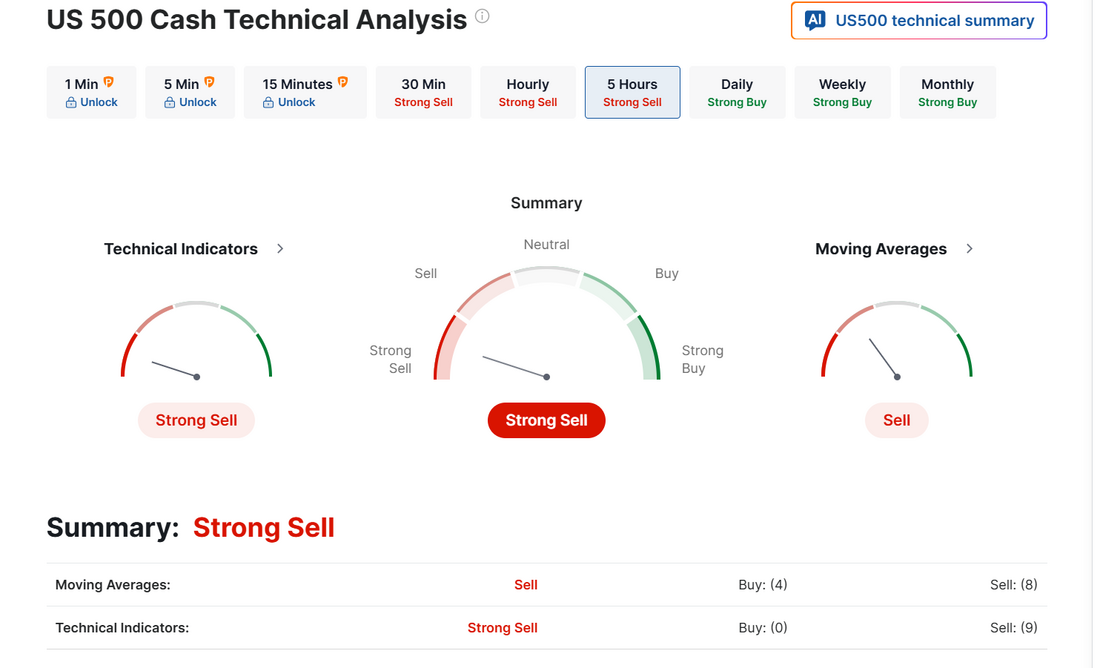
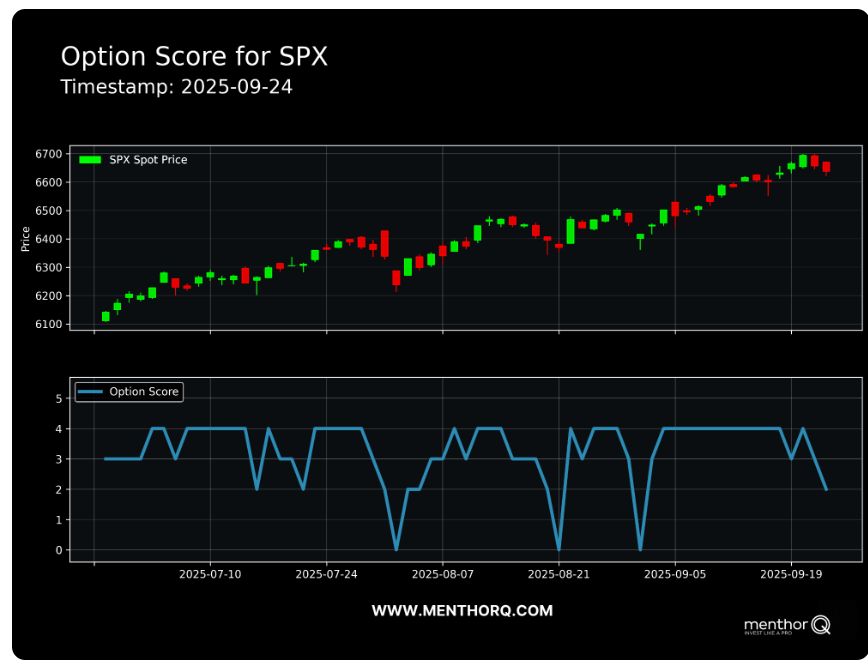
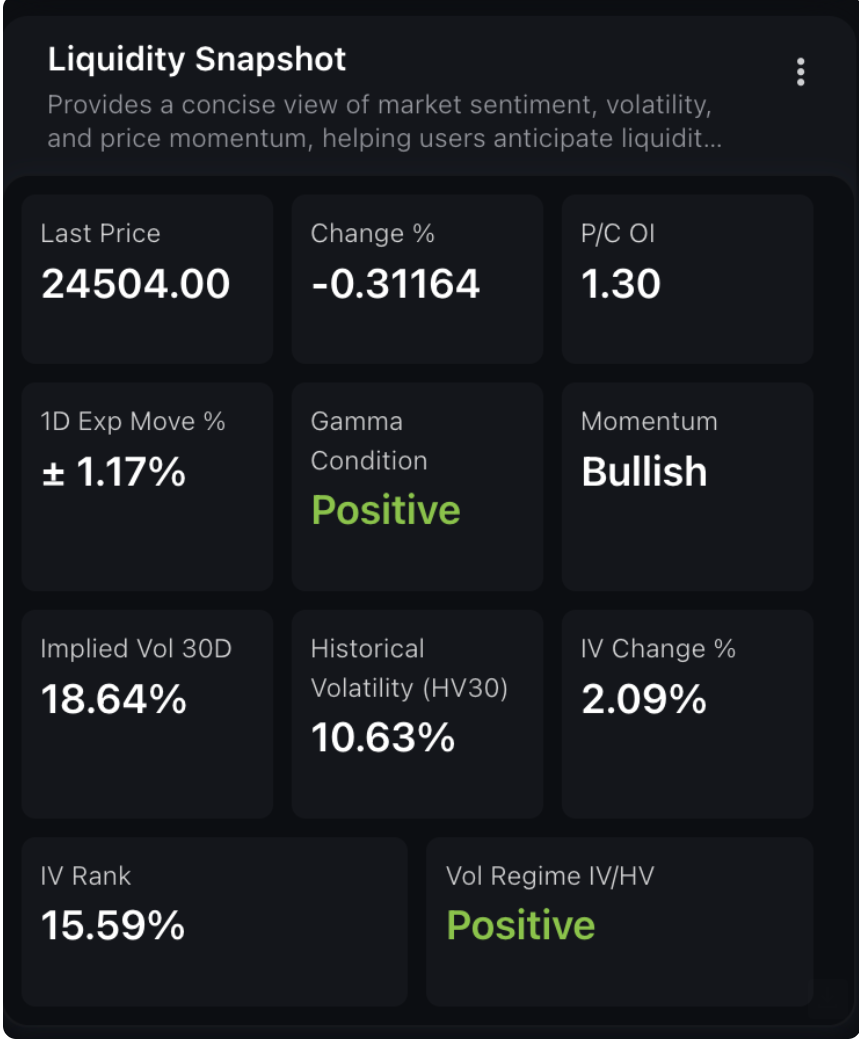
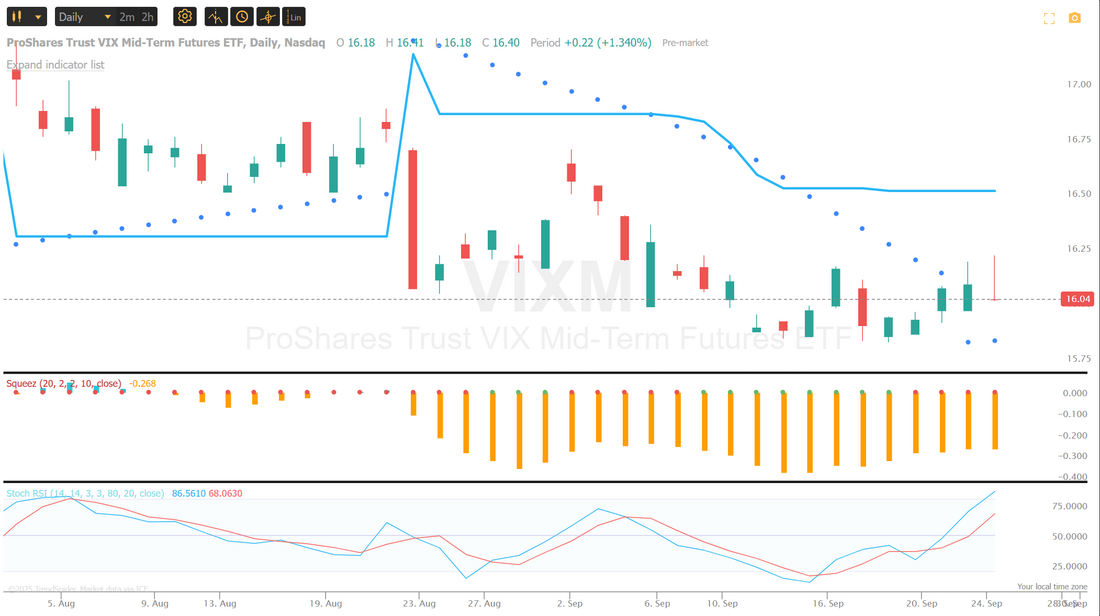
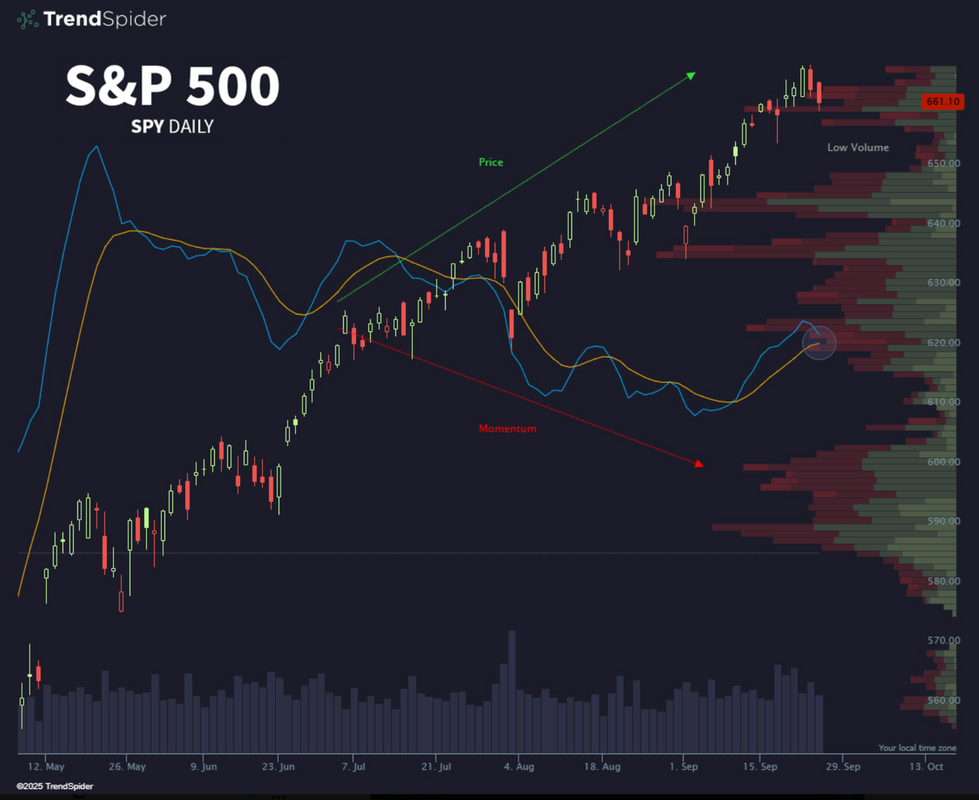
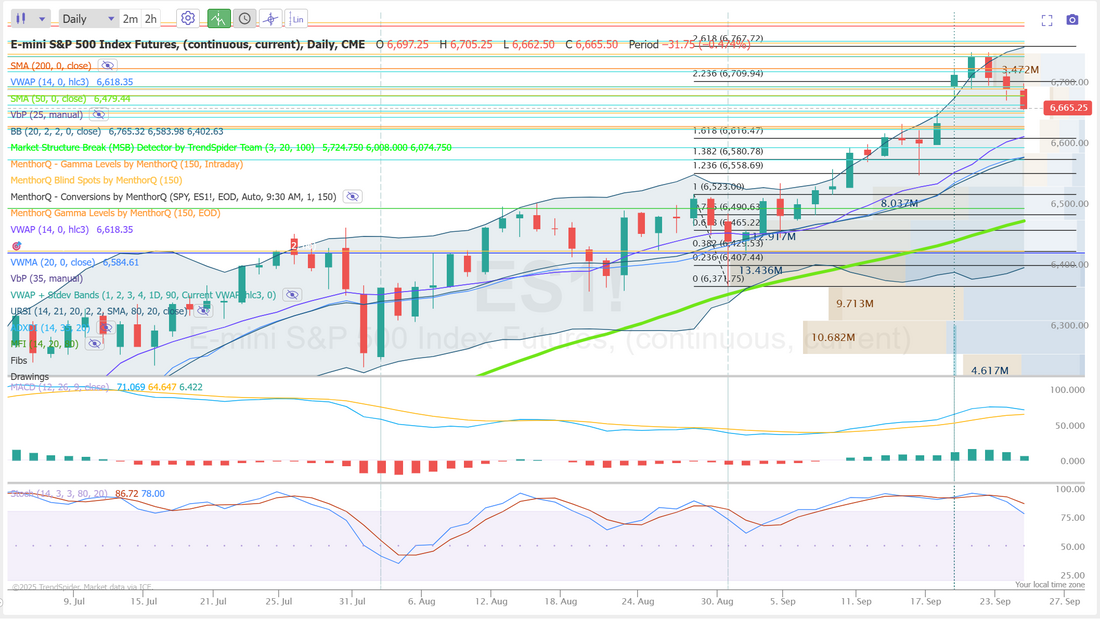
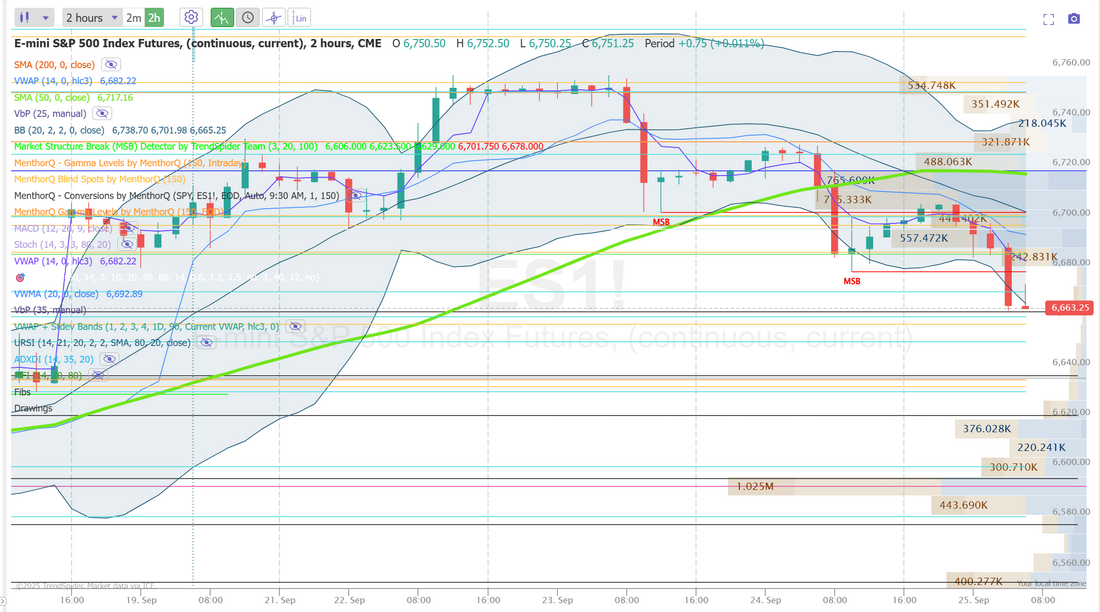
"Three black crows"When you get three successive down days where the lows of the day surpass the previous days low, you get a "three black crows" signal. It's bearish. Today could be the completion of that pattern. There's lots of day left so it's too early to tell but the bearish retrace we've been wanting could be at our doorsteps. One of our key mantras is " Don't let green turn to red". I did that yesterday. We should of just stopped with the profit we had. Here's a look at my day: Let's take a look at the new market dynamic. Today is a key day. Another red day today and we've got an official trend going. We've got a rare "sell" signal forming. December S&P 500 E-Mini futures (ESZ25) are down -0.28%, and December Nasdaq 100 E-Mini futures (NQZ25) are down -0.40% this morning, pointing to more weakness on Wall Street after two days of losses, while investors await a fresh batch of U.S. economic data, remarks from Federal Reserve officials, and an earnings report from bulk retailer Costco. In yesterday’s trading session, Wall Street’s three main equity benchmarks ended in the red. Freeport-McMoRan (FCX) tumbled nearly -17% and was the top percentage loser on the S&P 500 after the miner cut its Q3 copper and gold sales guidance and declared force majeure on contracted copper supplies from its Grasberg mine in Indonesia. Also, Bloom Energy (BE) plunged more than -10% after Jefferies downgraded the stock to Underperform from Hold with a price target of $31. In addition, Adobe (ADBE) fell over -2% after Morgan Stanley downgraded the stock to Equal Weight from Overweight. On the bullish side, Marvell Technology (MRVL) climbed more than +7% and was the top percentage gainer on the Nasdaq 100 after the semiconductor company’s board authorized a new $5 billion share repurchase program. Economic data released on Wednesday showed that U.S. new home sales unexpectedly surged +20.5% m/m to a 3-1/2-year high of 800K in August, stronger than expectations of 650K. Meanwhile, U.S. Treasury Secretary Scott Bessent on Wednesday voiced disappointment that Fed Chair Jerome Powell has not clearly outlined an agenda for lowering interest rates. “Rates are too restrictive; they need to come down,” Bessent said in an interview on Fox Business. “I’m a bit surprised that the chair hasn’t signaled that we have a destination before the end of the year of at least 100 to 150 basis points.” San Francisco Fed President Mary Daly said on Wednesday that more interest rate cuts will likely be needed, but noted that policymakers should proceed carefully. “It is likely that further policy adjustments will be needed as we work to restore price stability while providing needed support to the labor market,” Daly said. U.S. rate futures have priced in a 91.9% probability of a 25 basis point rate cut and an 8.1% chance of no rate change at October’s monetary policy meeting. Today, all eyes are focused on the U.S. Commerce Department’s final estimate of gross domestic product. Economists expect the U.S. economy to expand at an annual rate of 3.3% in the second quarter. Investors will also focus on U.S. Durable Goods Orders and Core Durable Goods Orders data. Economists expect August Durable Goods Orders to drop -0.3% m/m and Core Durable Goods Orders to fall -0.1% m/m, compared to the prior figures of -2.8% m/m and +1.1% m/m, respectively. U.S. Existing Home Sales data will be reported today. Economists foresee this figure coming in at 3.96 million in August, compared to 4.01 million in July. U.S. Wholesale Inventories data will come in today. Economists forecast the preliminary August figure at +0.2% m/m, compared to +0.1% m/m in July. U.S. Initial Jobless Claims data will be released today as well. Economists estimate this figure will come in at 233K, compared to last week’s number of 231K. In addition, market participants will hear perspectives from Chicago Fed President Austan Goolsbee, Kansas City Fed President Jeff Schmid, New York Fed President John Williams, Fed Governor Michelle Bowman, Fed Governor Michael Barr, Dallas Fed President Lorie Logan, and San Francisco Fed President Mary Daly throughout the day. On the earnings front, notable companies such as Costco (COST), Accenture (ACN), Jabil Circuit (JBL), and CarMax (KMX) are set to report their quarterly results today. In the bond market, the yield on the benchmark 10-year U.S. Treasury note is at 4.140%, down -0.19%. The SPX remains near recent highs around the 6,650 level, but the latest pullback alongside a dip in the option score hints at waning short-term conviction. Option sentiment has generally held in the mid-to-upper range over the past month, providing support to the broader trend, but recent fluctuations suggest choppier positioning as traders reassess momentum. In the short term, price action around 6,600–6,650 will be key in gauging whether this consolidation turns into a stronger push higher or if volatility re-emerges with a test of lower support levels. The NDX liquidity snapshot shows a last price of 24,504 with a modest dip on the day, though overall conditions remain constructive. A positive gamma backdrop combined with bullish momentum indicates that options positioning may help stabilize price action in the near term. Implied volatility at 18.64% sits notably above historical volatility of 10.63%, reflecting heightened demand for protection or speculative positioning, while a low IV rank of 15.59% suggests volatility is still relatively contained compared to longer-term levels. With the 1-day expected move at ±1.17%, short-term flows could remain active, especially as traders react to shifts in volatility pricing. $VIX up 3 days in a row… so far. Has not done 4 green days in a row since the heart of the April tariffs crash. Just something to think about and keep an eye on. Has anyone else noticed, as prices go higher and continue to hit new ATH's, momentum is starting to swing downward? We had a good training yesterday on ADX. It's one of our favorite indicators for intra-day trading. I'm looking forward to next Monday. We'll have a whole new topic to train on. Please join us on the live zoom feed then. Let's take a look at the new levels that have formed in the /ES. I don't know about you, but for me that's a pretty clean looking sell signal we've developed on the daily chart. Looking at the intra-day levels: 6670, 6678, 6685, 6702 are new resistance zones. 6662, 6656, 6649, 6636 are support zones. I always say, " a perfect day for us involves lots of movement...preferably down." That looks like what we may get today! I look forward to seeing you all in the live trading room shortly.
0 Comments
Your comment will be posted after it is approved.
Leave a Reply. |
Archives
September 2025
AuthorScott Stewart likes trading, motocross and spending time with his family. |
