Everything that shines is gold.Good holy moly! Gold is on a tear. Gold is up: 28 of the last 36 days. 9 weeks in a row. 8 of the last 10 months. 8 of the last 9 quarters.  Can you say "Parabolic"? 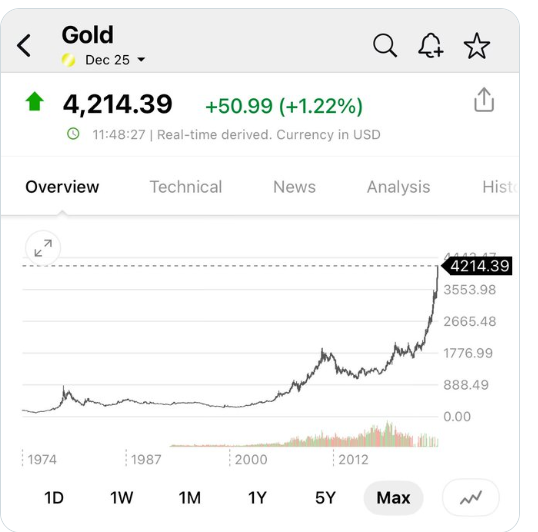 There's a lot of conjecture about what is all means. It's certainly not good for the dollar. It's generally considered a big warning sign for the economy. Who knows? I do know that what goes up usually comes down. What could that look like? Moves like this in the past have been followed with 18% avg. pull backs. Will that happen this time? Hard to say but it seems like a pull back is due...right. Right? We're working a small gold trade and working to keep our call side OTM. We had a solid day yesterday. It sure helps to have multiple tools to work with as you never know what the market is going to offer up. Scalping was our big winner yesterday. See our results below: 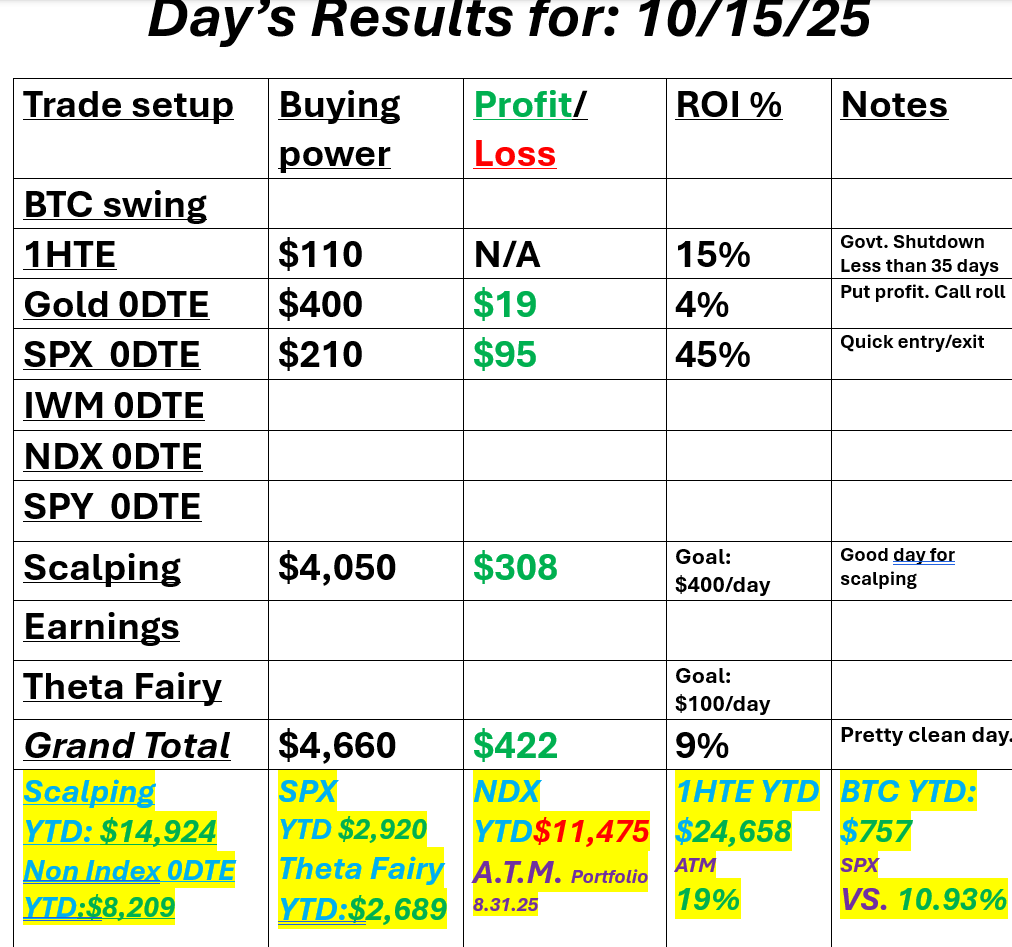 Let's take a look at the state of the markets. Buy mode is still locked in.  Yesterday was a green day but I'm looking at is as a bearish result. The overall trend is still down and we did end up selling off from the high of the open.  The SPX option score chart shows a rebound in sentiment after a recent short-term dip, with the score recovering from near-zero levels back toward mid-range territory. This uptick in the option score suggests that traders may be regaining confidence following last week’s volatility, aligning with the mild bounce in spot prices. However, the broader pattern over the past month reflects alternating bursts of optimism and caution a sign of short-term indecision in the options market. If the score maintains upward momentum over the next few sessions, it could indicate improving risk appetite, while another downturn might highlight renewed hedging activity. Overall, this remains a consolidation phase with traders closely watching follow-through on recent price recovery. 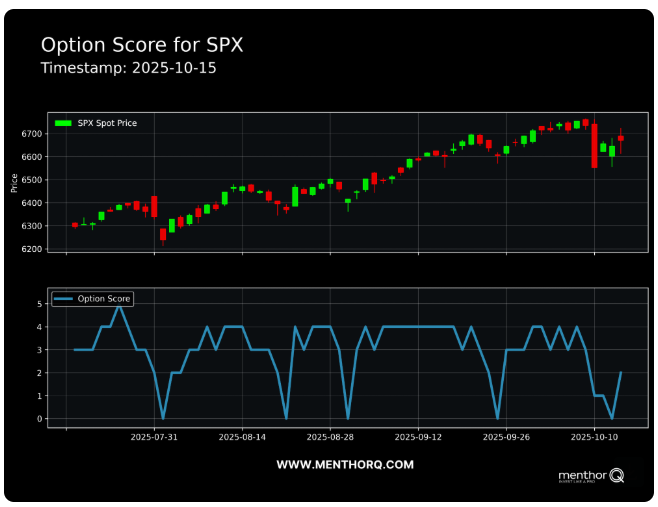 The 5-day swing model for QQQ shows the ETF holding within a tight trading band following recent volatility, with prices consolidating between the risk trigger near 584 and the upper band at 620. The model’s high overall success rate above 90% and strong lower-band performance suggest that downside levels have historically provided reliable short-term support. However, the recent move away from the lower band and toward mid-range territory indicates that momentum remains neutral but stabilizing. In the near term, traders may monitor whether QQQ can sustain upward momentum toward the upper band, a move that could signal renewed short-term strength, or if a rejection near current levels leads to another test of the risk trigger area. 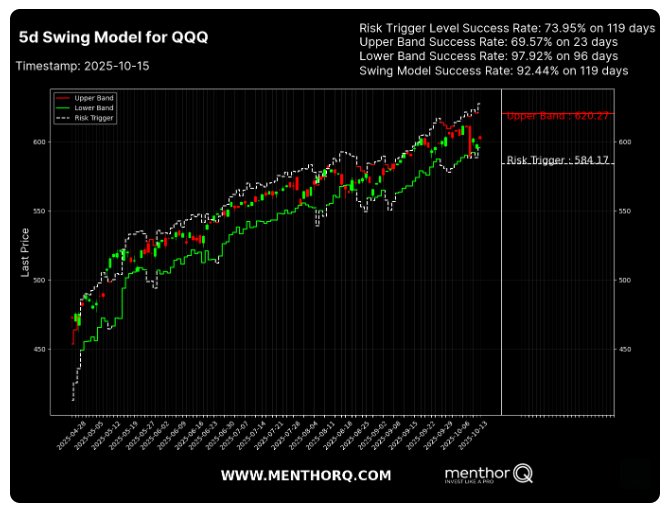 December S&P 500 E-Mini futures (ESZ25) are up +0.43%, and December Nasdaq 100 E-Mini futures (NQZ25) are up +0.48% this morning as signs of continued strong demand for artificial intelligence helped shift investors’ attention from escalating U.S.-China trade tensions. U.S.-listed shares of Taiwan Semiconductor Manufacturing Co. (TSM) rose over +1% in pre-market trading after the world’s biggest contract chipmaker reported record Q3 profit and raised its full-year revenue growth guidance. The results underscored that chipmakers are poised to be some of the biggest beneficiaries of an AI investment boom. AI-related U.S. heavyweights advanced in pre-market trading, with Nvidia (NVDA) and Broadcom (AVGO) rising more than +1%. Lower bond yields today are also supporting stock index futures. Investors now await a fresh batch of corporate earnings reports and remarks from Federal Reserve officials. In yesterday’s trading session, Wall Street’s three main equity benchmarks ended mixed. Bunge Global (BG) surged over +12% and was the top percentage gainer on the S&P 500 after President Trump said Washington was considering ending certain trade relations with China, including the purchase of cooking oil. Also, chip stocks rallied, with Advanced Micro Devices (AMD) climbing more than +9% to lead gainers in the Nasdaq 100 and KLA Corp. (KLAC) rising nearly +6%. In addition, Bank of America (BAC) gained more than +4% after the lender posted stronger-than-expected Q3 results. On the bearish side, Progressive Corp. (PGR) slid over -5% after the insurance giant reported weaker-than-expected Q3 results. Economic data released on Wednesday showed that the Empire State manufacturing index rose to 10.70 in October, stronger than expectations of -1.80. The Fed said Wednesday in its Beige Book survey of regional business contacts that U.S. economic activity was little changed in recent weeks, while employment levels remained largely stable. Three districts reported slight to modest growth in activity, five noted no change, and four reported a mild softening in activity. The report also noted that overall consumer spending declined slightly, while prices continued to rise, with several districts observing a quicker rise in input costs. “Tariff-induced input cost increases were reported across many districts, but the extent of those higher costs passing through to final prices varied,” according to the Beige Book. Some chose to keep selling prices mostly steady to retain customers, while others passed the higher import costs on to consumers in full. Fed Governor Stephen Miran said on Wednesday that escalating trade tensions between the U.S. and China have heightened uncertainty about the growth outlook, underscoring the need for policymakers to cut interest rates quickly. “There’s now more downside risks than there was a week ago, and I think it’s incumbent upon us as policymakers to recognize that should get reflected in policy,” Miran said. U.S. rate futures have priced in a 97.8% probability of a 25 basis point rate cut and a 2.2% chance of no rate change at October’s monetary policy meeting. Third-quarter corporate earnings season is gathering pace, and investors look ahead to new reports from prominent companies today, including Charles Schwab (SCHW), Bank of NY Mellon (BK), U.S. Bancorp (USB), CSX Corp. (CSX), and Travelers (TRV). According to Bloomberg Intelligence, companies in the S&P 500 are expected to post an average +7.2% increase in quarterly earnings for Q3 compared to the previous year, marking the smallest rise in two years. Meanwhile, the U.S. government shutdown continues, with no resolution in sight. In light of the government shutdown, the publication of weekly jobless claims, the September retail sales report, and the September PPI, originally set for today, will likely be delayed. Still, the Philadelphia Fed-compiled Manufacturing Index will be released today. Economists anticipate that the Philly Fed manufacturing index will stand at 8.6 in October, compared to last month’s value of 23.2. U.S. Crude Oil Inventories data will be released today as well. Economists expect this figure to be 0.3 million, compared to last week’s value of 3.715 million. In addition, market participants will hear perspectives from Fed Governors Christopher Waller, Michael Barr, and Stephen Miran, as well as Richmond Fed President Tom Barkin, Minneapolis Fed President Neel Kashkari, and Fed Vice Chair for Supervision Michelle Bowman throughout the day. In the bond market, the yield on the benchmark 10-year U.S. Treasury note is at 4.025%, down -0.52%. My lean or bias today: Who knows? Take a look at the 200 (red), 50 (green), 20 (blue) period moving averages on the 2 hr. chart. In technical terms that's called a "jumbled mess"! Futures are up as I type. Technicals are still bullish so I guess we lean bullish to start the day but not with a lot of conviction. 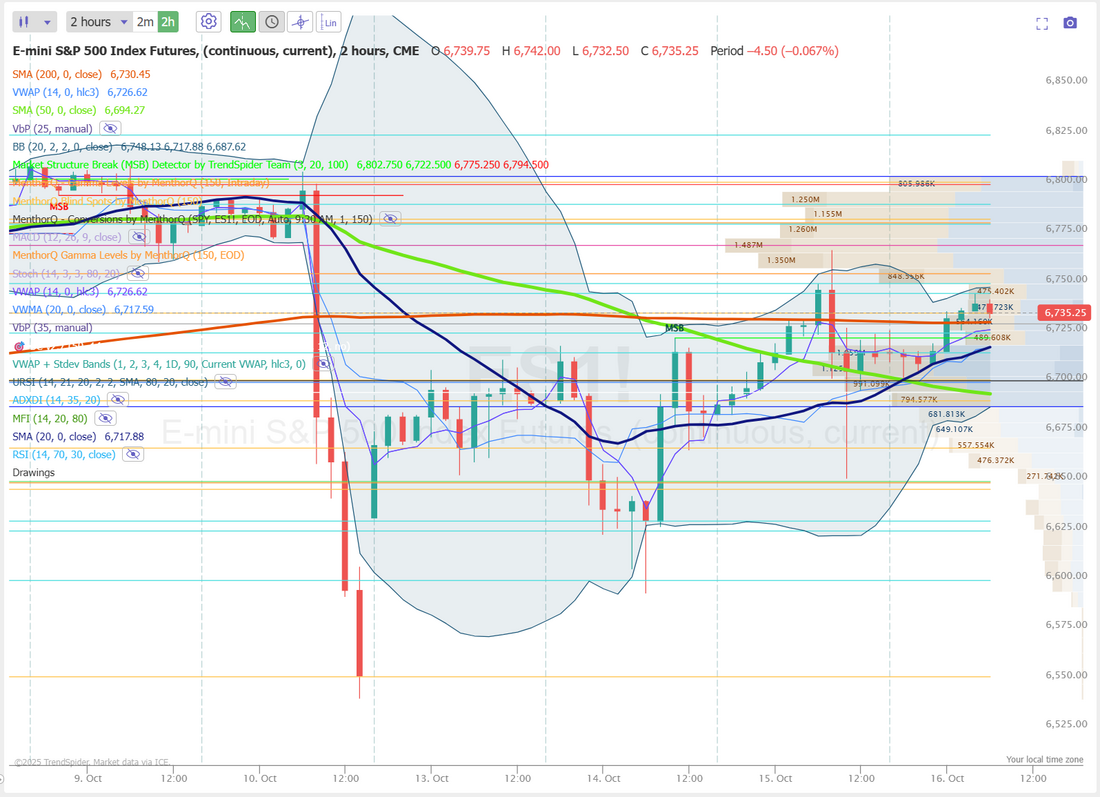  Todays training segment: Jesse Livermore | How Smart Traders Win Consistently. These have been great segments. Please tune in at 12:00 MDT to get some trading knowledge. Thursday News catalysts. Also, Trump is tentatively scheduled to speak at 3:00PM (China news?)
 Massive spike in VIX just before the close. Gold and the VIX are telling a different story than the bull market is. 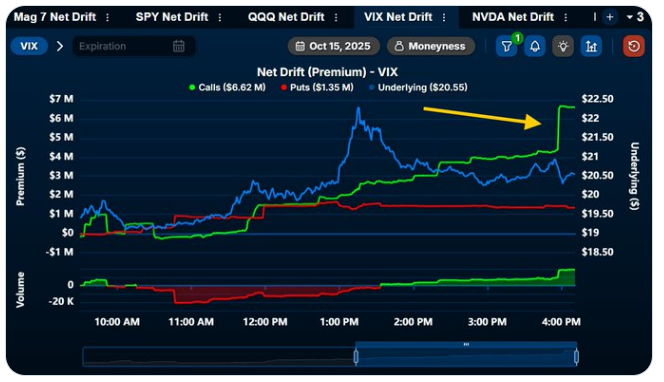 Looking for shorting ideas? Here's a list of billion dollar companies with no profits. 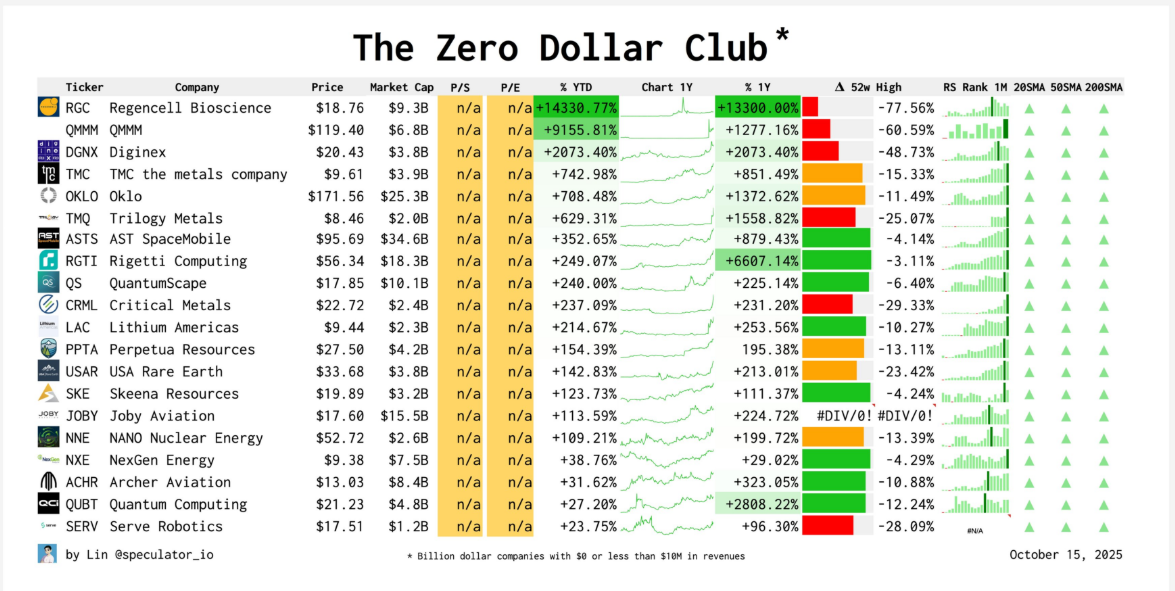 The bull run is in full swing: The S&P 500 has gone 98 trading sessions without a -5% decline, its 2nd-longest streak since 2021. This also marks one of the longest periods since the 2018 record of 403 trading days without a -5% drop. By comparison, the long-term average is 59 trading days. Since 1928, the market has seen an average of 3.4 declines of -5% per year. At the same time, a -10% correction has occurred an average of 1.1 times per year. Momentum is incredibly strong right now. 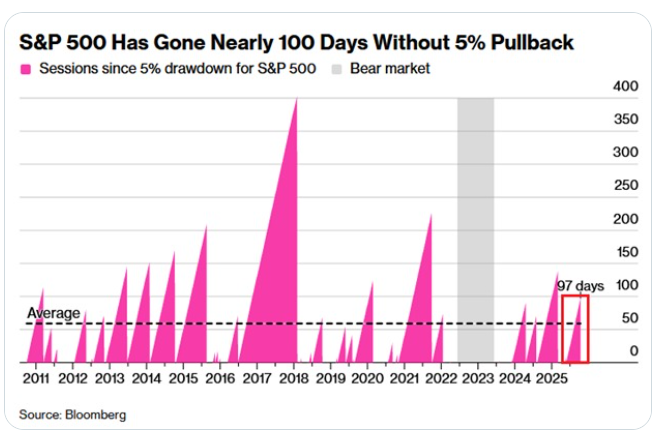 Let's take a look at our intraday levels on /ES: 6746, 6751, 6755, 6769, 6781 are resistance levels. 6755 is a big gamma wall and 6769 is a key level. It's where everything fell apart a few days ago. A recapture of that would be big for the bulls. 6736, 6730, 6725, 6701 are support levels. 6730 is big. It's the 200 period M.A. on the 2hr. chart. A break below that would be big for the bears. 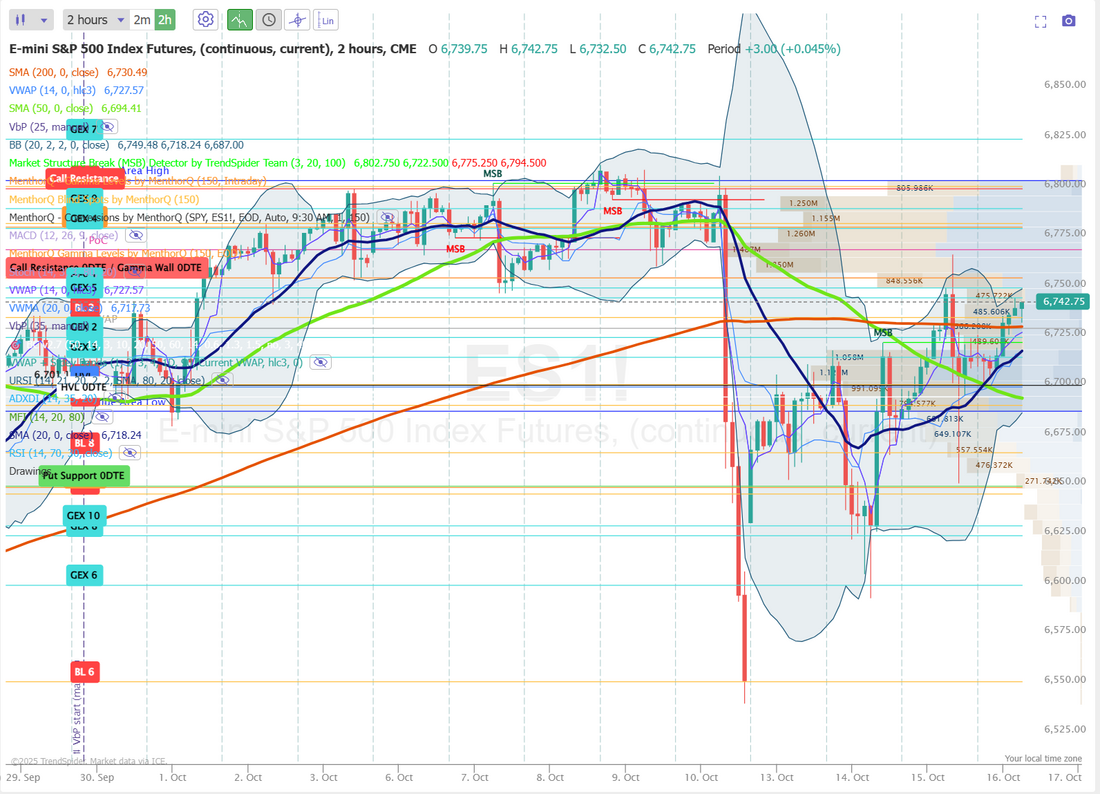 I'll see you all in the live trading room shortly. Let's put up some green again today!
0 Comments
Your comment will be posted after it is approved.
Leave a Reply. |
Archives
November 2025
AuthorScott Stewart likes trading, motocross and spending time with his family. 
|